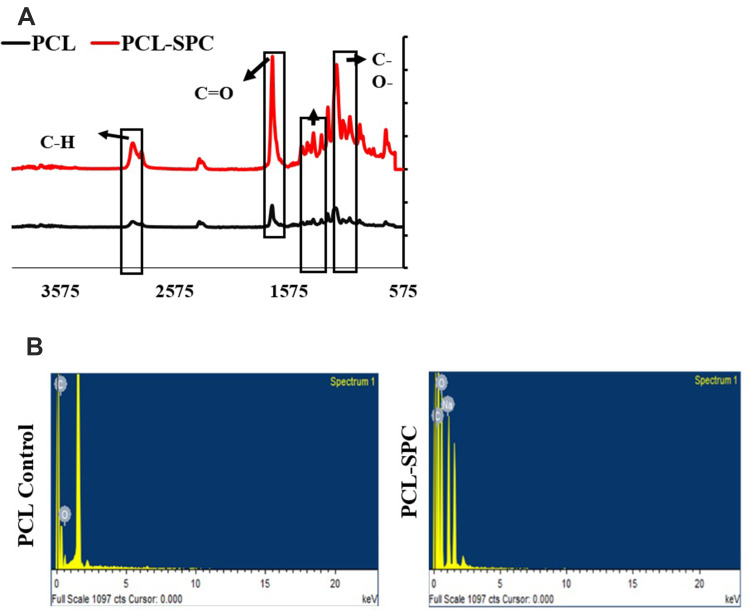
Figure 2.
FTIR and EDS analyses of nanofibrous wound dressings. (A) FTIR analysis of PCL-SPC and PCL-Control samples. The vibrations at 1,724 cm−1 and 1,471–1,418 cm−1 represent C=O and –CH2 stretches, respectively, arrows indicate various functional groups. (B) EDS analysis of PCL-SPC and PCL Control samples. PCL-Control spectrum showed peaks characteristic for the existence of carbon and oxygen elements only, confirming purity of the samples. The presence of sodium was confirmed by enhanced intensity of carbon and oxygen representative peaks.

