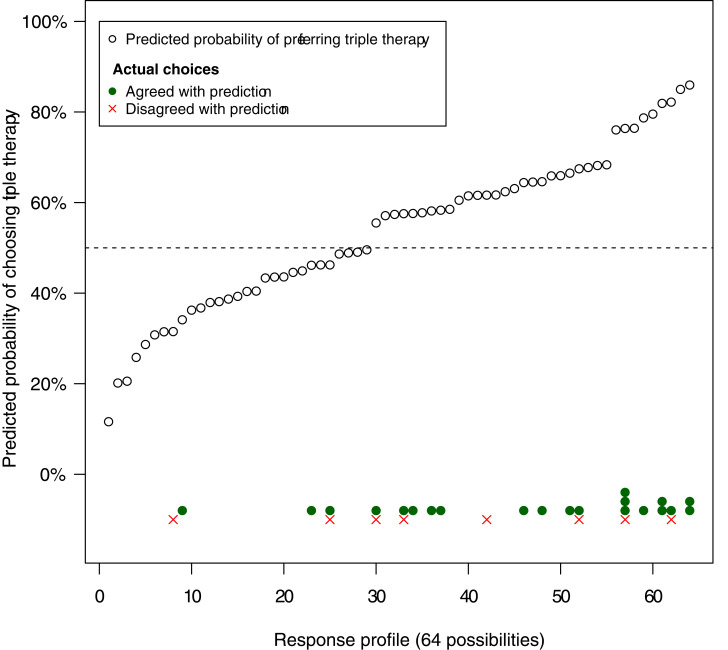
Figure 3.
Comparison of predicted versus stated preferences across all possible response profiles. The predicted probabilities are those displayed to the patient in the decision tool for each of the 64 possible response profiles. Probabilities above the 50% hashed line are anticipated to prefer triple therapy, while those below the hashed line prefer methotrexate. The actual response profile chosen by each patient is shown at the bottom of the figure, along with the agreement (yes/no) with the prediction.

