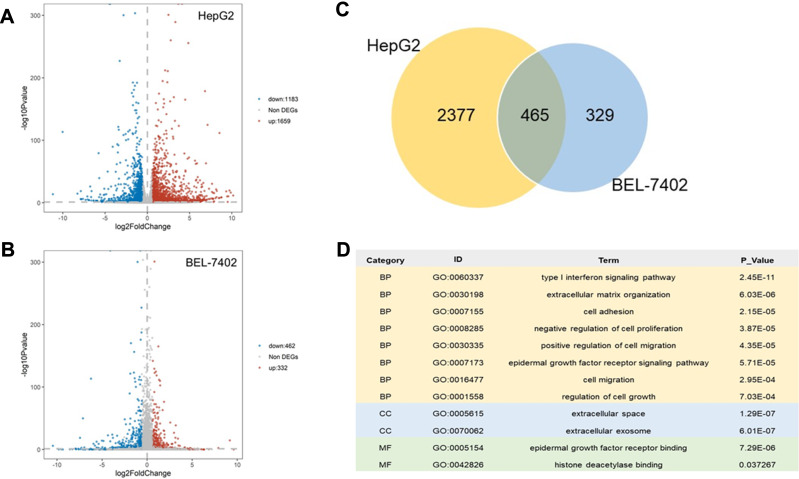
Figure 8.
Differential Expressed Genes and functional annotation after knocking out H2AFZ. (A, B) Volcano plot for differential expressed genes from knocking out H2AFZ in HepG2 cells and BEL-7402 cells. Differential expressed genes (DEGs): P-value <0.05 and (Foldchange >1.5 or Foldchange <1.5). (C) Venn diagram. Overlapped DEGs from HepG2 cells and BEL-7402 cells. (D) Partly significant GO terms from overlapped DEGs (P-value <0.05).

