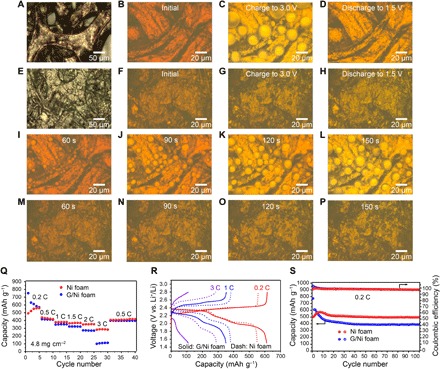
Fig. 3. In situ optical observation and electrochemical performance of the Ni foam and G/Ni foam electrodes in lithium polysulfide electrolyte.

Optical images of (A) Ni foam. Optical images of Ni foam in lithium polysulfide electrolyte (B) at initial state, (C) after charging to 3.0 V, and (D) discharging to 1.5 V. (E) G/Ni foam. Optical images of G/Ni foam in lithium polysulfide electrolyte (F) at initial state, (G) after charging to 3.0 V, and (H) discharging to 1.5 V. Snapshots of the constant voltage charging process for Ni foam electrode at (I) 60 s, (J) 90 s, (K) 120 s, and (L) 150 s. Snapshots of the constant voltage charging process for G/Ni foam electrode at (M) 60 s, (N) 90 s, (O) 120 s, and (P) 150 s. (Q) Rate performance of the Ni foam and G/Ni foam electrodes at different current densities. (R) Charge/discharge voltage profiles of the Ni foam (dash line) and G/Ni foam (solid line) electrodes at 0.2, 1, and 3 C. (S) Cycling performance and Coulombic efficiency of the Ni foam and G/Ni foam electrodes at 0.2 C for 100 cycles.
