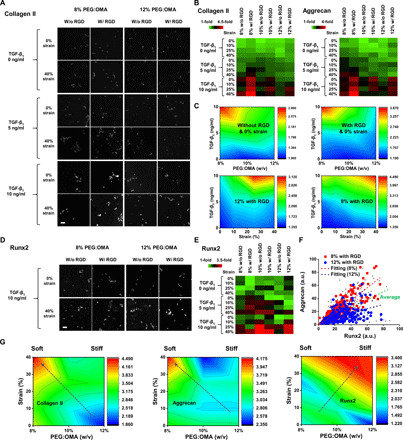
Fig. 2. Cross-linking density of PEG/OMA that could guide different levels of both degradation and stiffness regulates expression level of markers associated with articular or hypertrophic chondrogenesis of hMSCs.

(A) Representative 3D confocal images of hMSCs stained with collagen II in different combinations of parameters. (B) Quantified heat maps of collagen II and aggrecan markers for cells encapsulated in the hydrogel microarrays cultured with combinations of all the factors for 21 days (n = 4). All data were normalized by the condition, 10% PEG/OMA without the presence of RGD, compressive stain, and TGF-β1 supplement. (C) Surface plot displaying the effect of the two variables on chondrogenic marker expression (collagen II) of hMSCs when other two factors are fixed. (D) Representative 3D confocal images of hMSCs stained with representative osteogenic marker (Runx2) in different combinations of parameters. (E) Quantified heat maps of Runx2 for cells encapsulated in the hydrogel microarrays cultured with combinations of all the factors for 21 days (n = 4). (F) Plot of measured immunofluorescence intensity data to define the role of Runx2 in lineage specification of hMSCs. Data were selected randomly (n = 1000). a.u., arbitrary unit. (G) Surface plot displaying the effect of the variables composition and strain on collagen II, aggrecan, Runx2 expression of hMSCs with other factors (with RGD and 10 ng/ml TGF-β1 supplement) fixed. Scale bars, 100 μm.
