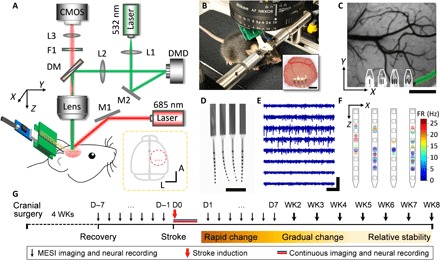
Fig. 1. The multimodal neural interface for simultaneous mapping of CBF and neuronal electrical activity.

(A) Schematics of the multimodal measurement. The optical paths for targeted photothrombosis (532 nm, green) and the speckle imaging (685 and 785 nm, red) were sketched. DM, dichroic mirror. F1, filter. L1 to L3, lenses. M1 and M2, mirrors. Inset: The dashed circle shows the anatomical location of the cranial window relative to bregma (gray dot). Red dots indicate the implantation sites of the four-shank probes. A, anterior. L, lateral. (B) Photograph of a mouse on a treadmill under the imaging apparatus implanted with NETs and a cranial window. Inset: Photo of the cranial window at 10 weeks after surgery. Photo credit: Fei He, Rice University. (C) A representative LSCI of prestroke CBF, where the green shade highlights the arterioles for targeted photothrombosis and the white lines outline the NETs. (D) Photograph of a NET array (4 by 8 recording sites) in water showing its ultraflexibility. Photo credit: Fei He, Rice University. (E) Typical recording traces (300-Hz high-pass filtered) from eight recording sites on one NET shank. (F) Spatially resolved spike activities from a 5-min representative recording session using a 4 by 8 NET array. Squares sketch individual contacts; dots are color-coded to present spike rates, whose locations are estimated as the averaged locations of the contacts weighted by the spike magnitudes they detect. (G) Experimental procedure and timeline. Scale bars, 500 μm [(B) (inset), (C), and (D)], 400 μV [vertical in (E)], and 200 ms [horizontal in (E)]. D, day. WK, week.
