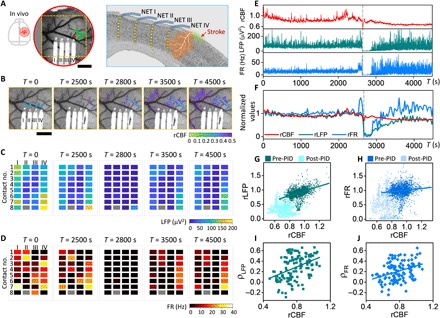
Fig. 2. Neurovascular coupling weakens with ischemia in acute periods after stroke.

(A) Sketch of the skull (left) and LSCI of CBF (middle) and sketch on a coronal section (right) showing the locations of the cranial window, four NET shanks, and 32 contacts in (B to D) and the targeted arteriole for photothrombosis (shaded in green). Red square marks the region of interest (ROI) used to quantify rCBF in (E and F). (B) Time series of LSCI of CBF at the acute stroke session. The overlaid color map shows the area of rCBF <50% baselined against prephotothrombotic images. Blue triangles mark the NET implantation sites. (C and D) Time series of LFP at 60 to 110 Hz and FR from all NET contacts at the acute stroke session. Time points match those of (B). Roman and Arabic numbers mark the NET shanks and contacts along the depth, respectively. One disconnected contact (II-8) is plotted in gray. (E and F) Simultaneous measurement of LFP and FR recorded by contact IV-4 and CBF from the ROI in (A) during and following photothrombosis. Normalized and 30-s averaged values were used in (F) to visualize the neurovascular dissociation. Dashed lines mark a PID event that was excluded from the following analysis. (G and H) Scatter diagrams of rCBF and rLFP at 60 to 110 Hz (G) and rCBF and rFR (H) for all locations (n = 39) and animals (N = 10) showing the positive linear correlation (darker color) breaks down as ischemia worsened (lighter color) after a PID occurred. (I and J) Correlation coefficients computed between rCBF and rLFP (I) and between rCBF and rFR (J). Pearson’s correlation was applied: ρ = 0.42, P = 4 × 10−94 (G); ρ = 0.12, P = 8 × 10⁻⁹ (H); ρ = 0.40, P = 3 × 10⁻⁶ (I); ρ = 0.35, P = 1 × 10⁻⁴ (J). Scale bars, 500 μm (A and B).
