
Fig. 1. Glycan array analyses of glycan binding by CDCs.
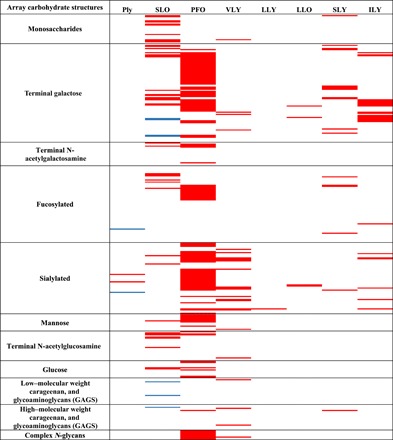
Red indicates binding above background. Blue indicates binding observed here and previously (9). White indicates that the structure was not bound. Classes of glycans arrayed are indicated to the left of the figure. A complete list of glycan structures on the array and the mean fold fluorescence increase above background of three replicate glycan array experiments are shown in data S1. GAGs, glycosylaminoglycans.