
Fig. 3 The endometrial effects of different interventions on morphology and ultrastructure.
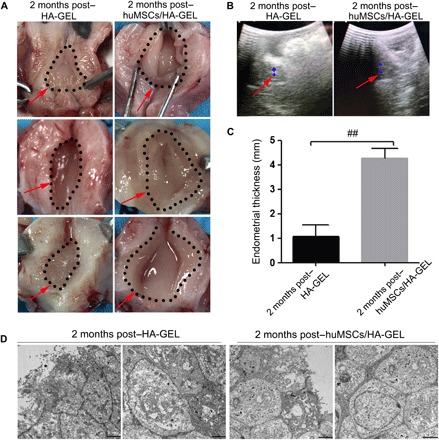
(A) Representative images of uterine cavities in the HA-GEL transplantation and huMSCs/HA-GEL transplantation groups (the dotted area and the red arrow mark the endometrial area). (B) Representative images of endometrial thickness for ultrasound detection in the HA-GEL transplantation and huMSCs/HA-GEL transplantation groups (the red arrow marks the endometrial echo; the blue area marks the largest cross section of the endometrium). (C) Comparisons of endometrial thickness between the HA-GEL transplantation group and the huMSCs/HA-GEL transplantation group. (D) Representative images of ultrastructural changes in the HA-GEL transplantation and huMSCs/HA-GEL transplantation groups (the left panel shows the surface of epithelial cells; the right panel shows the intercellular changes). ##P < 0.01 versus 2 months post–HA-GEL, and the results shown are the mean ± SEM of three technical replicates from each animal. Photos provided by Lingjuan Wang and Chengliang Xiong (Institute of Reproductive Health, Center of Reproductive Medicine, Tongji Medical College, Huazhong University of Science and Technology).