
Fig. 4Comprehensive assessment for the effects of different interventions on endometrial regeneration and remodeling.
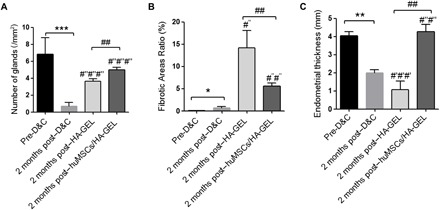
(A) Comparisons of endometrial gland numbers per unit area. (B) Comparisons of ratios of fibrotic area (%). (C) Comparisons of endometrial thickness (mm). *P < 0.05, **P < 0.01, and ***P < 0.001, all versus pre-D&C; #′#′#′P < 0.001 versus pre-D&C; #″P < 0.05, #″#″P < 0.01, and #″#″#″P < 0.001, all versus 2 months post-D&C; ##P < 0.01 versus 2 months post–HA-GEL, and the results shown are the mean ± SEM of three technical replicates from each animal.