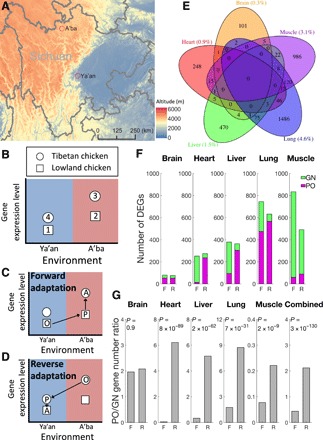
Fig. 1. Reciprocal transplant experiments reveal plastic and genetic differences in gene expression levels between Tibetan and lowland chickens.

(A) Map showing the locations and altitudes of the two experimental sites in Sichuan Province, China. Adapted with permission from (33). (B) Design of the reciprocal transplant experiment, in which each of the two breeds are phenotyped in its native environment and the other breed’s native environment. Different symbols indicate different breeds, and different colors indicate different environments where chickens are hatched, reared, and phenotyped. The four samples of chickens phenotyped are numbered. The diagram shows the scenario in which the gene expression level is higher in sample 3 than in sample 1, but the same principle applies if the opposite is true. (C) Samples 1, 2, and 3 in (B) respectively represent the original (O), plastic (P), and adapted (A) stages during the forward adaptation from the lowland to highland. (D) Samples 3, 4, and 1 in (B) respectively represent the O, P, and A stages during the reverse adaptation from the highland to the lowland. (E) Venn diagram showing the number (and percentage) of differentially expressed genes (DEGs) in each tissue between samples 1 and 3 in (B). (F) Numbers of DEGs in each tissue that are plastic-change-only (PO) or genetic-change-needed (GN) during the forward (F) or reverse (R) adaptation. (G) Number of DEGs that are PO divided by the number of DEGs that are GN in F or R adaptation in each tissue and all tissues combined. P values are based on a G test of independence.
