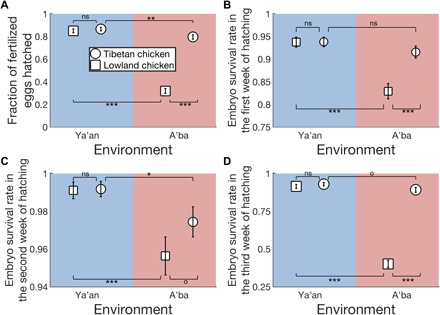
Fig. 2. Reciprocal transplant experiments reveal plastic and genetic differences in egg hatchability between Tibetan and lowland chickens.

(A) Fraction of fertilized eggs that are hatched. (B) Survival rate of chicken embryos in the first week of hatching, measured by the number of viable embryos on day 7 divided by the corresponding number on day 0. (C) Survival rate of chicken embryos in the second week of hatching, measured by the number of viable embryos on day 14 divided by the corresponding number on day 7. (D) Survival rate of chicken embryos in the third week of hatching, measured by the number of viable embryos on day 21 divided by the corresponding number on day 14. Breeds are indicated by symbols, while environments are indicated by colors. Error bars show one standard error based on the binomial distribution. P values determined by a G test of independence are shown as follows: ns, P > 0.06; o, 0.05 < P < 0.06; *, 0.01 < P < 0.05; ** 0.001 < P < 0.01; and ***, P < 0.001.
