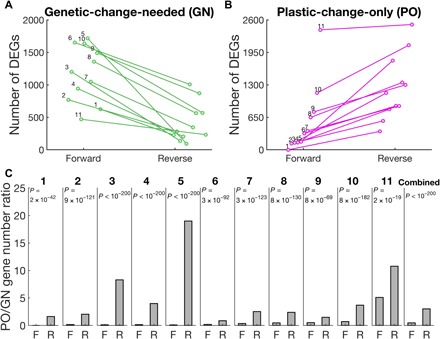
Fig. 3. Reciprocal transplant experiments reveal plastic and genetic differences in gene expression levels between E. coli strains adapted to a benign environment and those adapted to 1 of 11 harsh environments.

The experimental design is analogous to that in Fig. 1B. (A) Numbers of DEGs that are GN in the forward adaptation from the benign environment to one of the harsh environments and the reverse adaptation from each harsh environment to the benign environment. Each line represents the result of one pair of forward and reverse adaptations. (B) Number of DEGs that are PO in F and R adaptations. (C) Number of DEGs that are PO divided by the number of DEGs that are GN in F and R adaptations for each harsh environment and all 11 environments combined. P values are based on a G test of independence. The benign environment is the M9 medium with glucose (5 g/liter), whereas the harsh environments numbered 1 to 11 respectively contain cobalt chloride (16 μM), sodium carbonate (32.5 mM), methylglyoxal (350 μM), cetylpyridinium chloride (4.8 μM), crotonate (50 mM), n-butanol (1.25%), methacrylate (8.75 mM), potassium chloride (210 mM), l-lactate (40 mM), sodium chloride (400 mM), and l-malate (30 mM).
