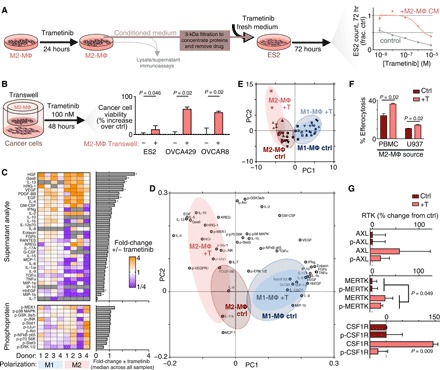
Fig. 3. MAPKi polarizes MΦs toward an alternatively activated, HGF- and GAS6-producing phenotype.

(A) Schematic of M2-MΦ conditioned medium experiments (left) and data showing ES2 cell count following 72-hour trametinib ± conditioned medium from M2-MΦ that were pretreated with 24-hour trametinib (right) (n = 3). (B) OVCA viability was measured by propidium iodide and annexin V staining for three cell lines treated for 48 hours with 100 nM trametinib ± transwell coculture with M2-MΦ (averaged across five donors with n = 3 reps per donor, two-tailed t test). (C) Heat map of supernatant and lysate proteins from PBMC-derived M1-MΦ and M2-MΦ. Analyte levels of MΦs treated with 24-hour trametinib are plotted relative to their respective no-treatment controls (n = 3, *P < 0.05, two-tailed Mann-Whitney U test with false discovery rate correction). GM-CSF, granulocyte-MΦ CSF; TGFα, transforming growth factor–α; TNFα, tumor necrosis factor–α; p-NFκB, phosphorylation of nuclear factor κB. (D and E) Loading (D) and score (E) plots generated from principal components analysis (PCA) of data from (C). Red shadings represent M2-MΦ, blue shadings represent M1-MΦ, and gray shading superimposed on each represents control conditions. (F) MΦ uptake of trametinib-treated ES2 cell debris following pretreatment of M2-MΦ with (+T) trametinib (n = 3, two-tailed t test). (G) RTK levels of U937-derived M2-MΦ, 24 hours after trametinib (n = 3 and n = 6 for pooled MERTK two-tailed t test). Data are means ± SEM for all.
