. 2020 May 22;9:e51358. doi: 10.7554/eLife.51358

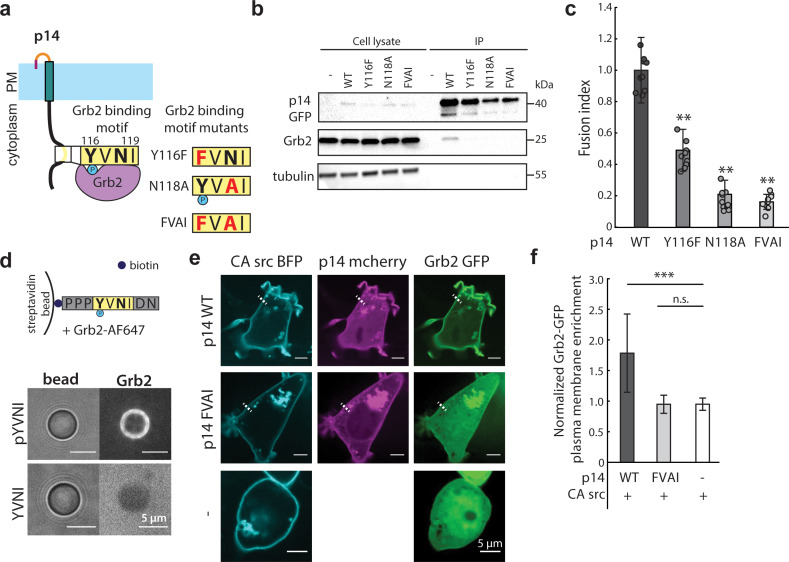
Figure 3. p14 Y116 in the cytoplasmic tail binds to Grb2.

(a) Schematic of p14 mutants that disrupt predicted Grb2 binding motif. (b) Western blot of co-immunoprecipitation of p14 with Grb2 (lane 7) and p14 mutants, Y116F, N118A, FVAI, that does not bind Grb2 (lane 8, 9, 10). (c) Average fusion index of p14 mutants with error bars representing standard deviations from 3 independent transfections of 3 wells each. P-values are two-tailed, two-sample Student’s t-test where *** = p<0.001 (See also Figure 3—figure supplement 1a, (b). (d) Streptavidin beads with biotinylated phosphorylated and non-phosphorylated Y116 p14 cytoplasmic tail peptide encoding (P113-N121) binds and did not bind to purified Grb2 respectively (See also Figure 3—figure supplement 1c, (d). (e) Confocal images of Grb2-GFP (green) enrichment to the plasma membrane of cells co-expressing p14 WT, p14 FVAI mCherry (magenta) and wildtype HEK293T with constitutively active c-src kinase (cyan). (f) Average normalized Grb2-GFP plasma membrane enrichment in cells co-expressing constitutively active c-src and either p14 WT (n = 33 cells) or p14 FVAI (n = 26 cells) or expressing constitively active c-src alone (n = 24 cells). Error bars represent standard deviations from three independent transfsections. P-values are two-tailed, two-sample Student’s t-test where *** = p<0.001 and n.s. = p>0.05.

Figure 3—source data 1. Excel Spreadsheet of plasma membrane enrichment of Grb2-GFP in cells expressing CA-src alone or with p14-WT-mcherry or with p14-FVAI mcherry.

Figure 3.

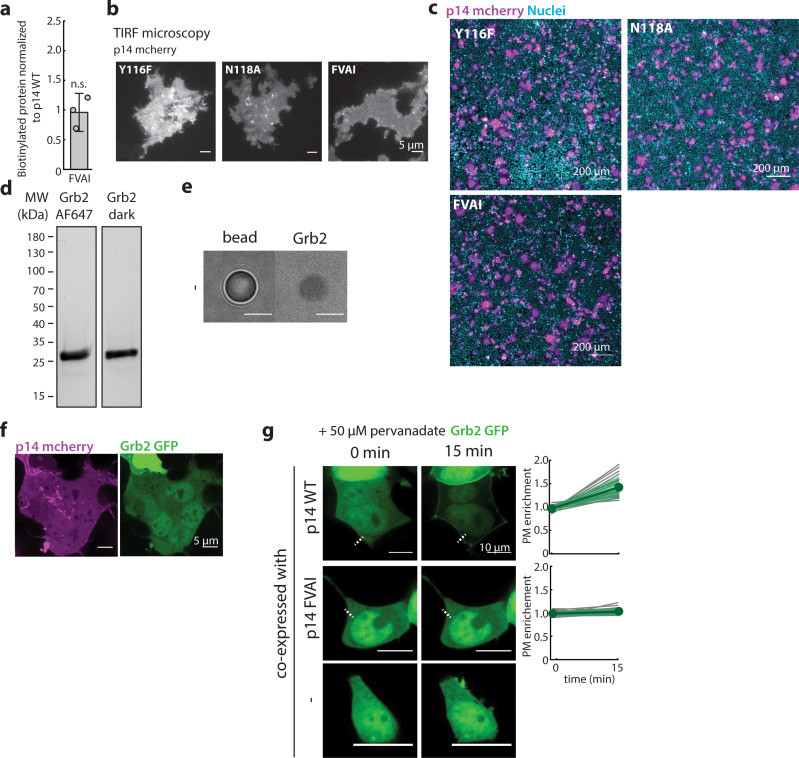
Figure 3—figure supplement 1. Characterization of Grb2 binding to p14.

Figure 3—figure supplement 1.

(a) Average biotinylated p14 FVAI to that of p14 WT. Error bars represent standard deviations from three independent transfections and biotinylation. P-values are two-tailed two-sample Student’s t-test to p14 WT n.s. = p>0.05. Representative western blot is in Figure 1—figure supplement 1g. (b) p14 mutants, Y116F, N118A, FVAI, are trafficked to the plasma membrane as visualized with TIRF microscopy. (c) Representative field of view of HEK293T cells expressing p14 WT and p14 mutants with p14 labeled with C-terminus mcherry (magenta), nuclei stained with Hoechst 33342 (cyan). (d) Coomaisse stain of purified human Grb2 (right) and labeled with AlexaFluor647 (left). (e) Biotin bead incubated with purified Grb2 has minimal binding. (f) p14-WT-mcherry (magenta) co-expressed with Grb2-GFP (green) in non-treated WT HEK293T cells. (g) Confocal images of Grb2 enrichment to the plasma membrane of cells upon treating with pervanadate with line scans of fluorescence intensity of each protein. Green line denotes the average fluorescence intensity from 20 p14 WT-expressing cells and 14 p14 FVAI expressing cells across 3 independent transfections. Grb2 does not re-localize to plasma membrane for p14 FVAI and HEK293T WT cells (bottom two rows).
Figure 3—figure supplement 1—source data 1. Excel Spreadsheet of surface biotinylation of p14-WT-GFP and p14-FVAI-GFP for Figure 3—figure supplement 1a.