. 2020 May 22;9:e51358. doi: 10.7554/eLife.51358

Figure 4. N-WASP-dependent assembly of branched actin network is necessary for cell-cell fusion.

(a) Schematic of Grb2 binding to two potential downstream effectors, SOS and N-WASP (b) Extent of cell-cell fusion quantified with splitYFP fluorescence assay of p14 expressing cells treated sorafenib tosylate targeting Raf kinase, wiskostatin targeting N-WASP, CK-666 targeting Arp2/3 and smifH2 targeting formins, normalized to that of p14 WT treated with vehicle control, DMSO. Error bars indicate standard deviations from 3 independent transfections of 3 wells each. P-values are two-tailed, two-sample Student’s t-test to DMSO where ** = p<0.01, *** = p<0.001 and n.s. = p>0.05. (c) Average percent of p14-expressing cells with 3 or more nuclei in HEK293T WT cells and HEK293T cells overexpressing Grb2 SH2 domain, N-terminus SH2-SH3 mutant and C-terminus SH2-SH3 mutant. P-values are two-tailed, two-sample Student’s t-test where ** = p<0.01, *** = p<0.001 and n.s. = p>0.05. Error bars represent standard deviations from 3 independent transfections (See also Figure 4—figure supplement 1a,b,c,d, and Figure 4—source data 1). (d) Average percent of p14-expressing cells with 2 or more nuclei in N-WASP -/- and +/+ cells with error bars representing standard deviations from 3 independent transfections. P-values are two-tailed, two-sample Student’s t-test where ** = p<0.01 (See also Figure 4—figure supplement 1g). (e) In vitro actin bead motility of phosphorylated p14 cytoplasmic tail peptide conjugated to streptavidin beads in a purified actin motility mixture supplemented with Grb2. Polymerized actin is visualized with AlexaFluor488-labeled utrophin actin binding domain (See also Figure 4—figure supplement 1h).

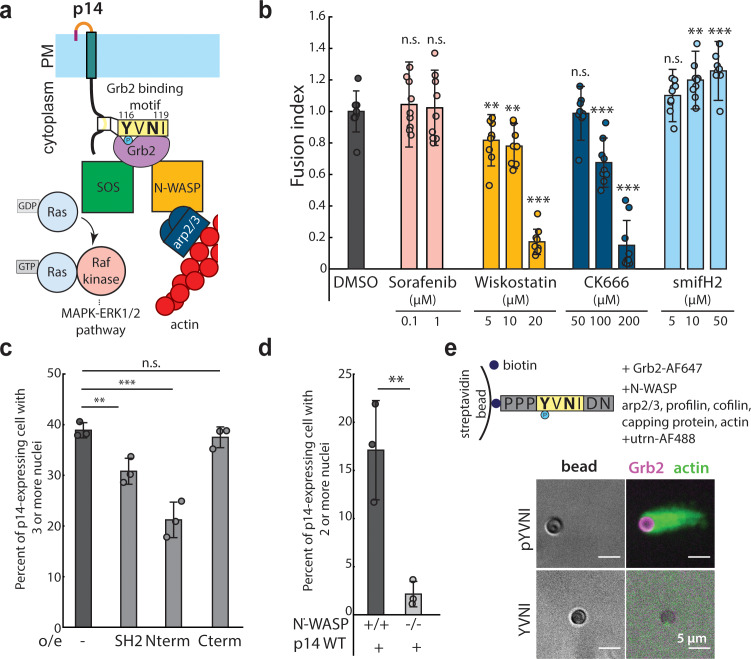
Figure 4—source data 1. Excel Spreadsheet of counts and distribution for p14-expressing HEK293T cells over-expressing Grb2 mutants for Figure 4c.
Figure 4—source data 2. Excel Spreadsheet of counts and distribution for p14-expressing N-WASP -/- or +/+ mouse embryonic fibroblasts for Figure 4d.

Figure 4.

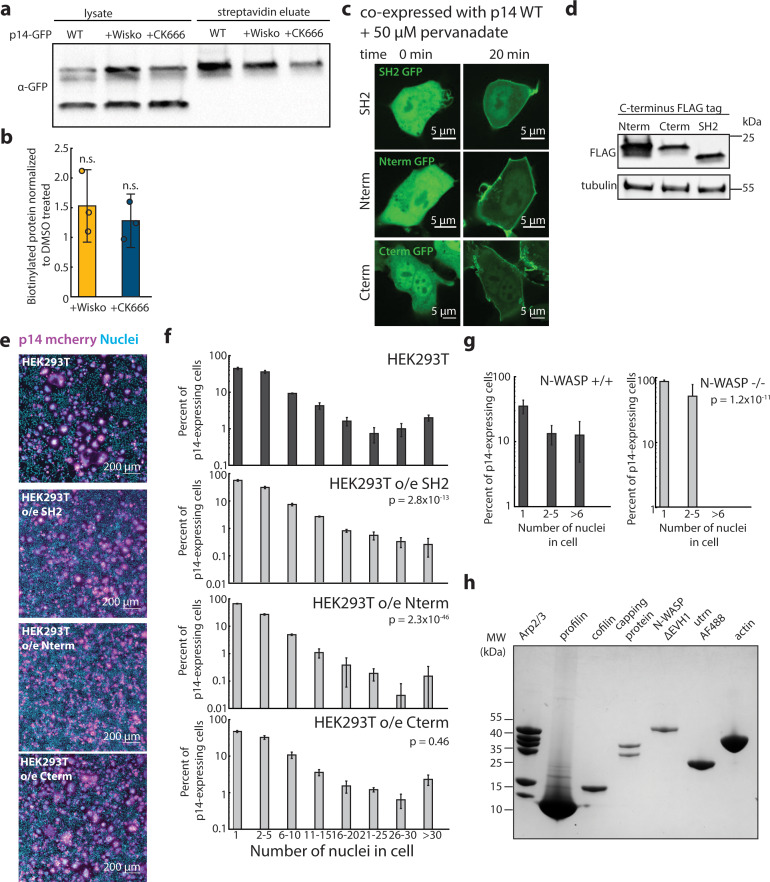
Figure 4—figure supplement 1. Characterization of over-expression of Grb2 mutants and purified components of actin motility assay.

Figure 4—figure supplement 1.

(a) Western blot of surface biotinylated GFP-tagged p14 WT treated with eitherDMSO, Wiskostatin or CK-666. (b) Average biotinylated p14 WT treated with Wiskostatin and CK-666 normalized to that of DMSO-treated p14 WT. Error bars represent standard deviations from three independent transfections and biotinylation. P-values are two-tailed, two-sample Student’s t-test to p14 WT where n.s. = p>0.05. (c) Representative confocal images of HEK293T cells over-expressing Grb2 mutants tagged with GFP before and after addition of pervanadate to increase p14 phosphorylation. Grb2 mutants are functional, and colocalizes with p14 at the plasma membrane. (d) Western blot of HEK293T cells over-expressing FLAG-tagged Grb2 mutants. (e) Representative field of view of HEK293T cells and HEK293T cells over-expressing Grb2 mutants transfected with p14 WT with p14 labeled with C-terminus mcherry (magenta), nuclei stained with Hoechst 33342 (cyan). (f) Average nuclei count of p14-expressing HEK293T cells and HEK293T overexpressing SH2 domain, N-terminus SH3 and SH2 and C-terminus SH3-SH2 domains of Grb2. P-values are ks-test and error bars represent standard deviation of 3 independent transfections. (g) Average nuclei count of p14-expressing N-WASP -/- and +/+ cells. P-values are ks-test and error bars represent standard deviation from 3 independent transfections. (h) Coomaisse stain of SDS-PAGE of each protein used in vitro actin motility assay.
Figure 4—figure supplement 1—source data 1. Excel Spreadsheet of surface biotinylation of p14-WT-GFP treated with wiskostatin and CK-666 for Figure 4—figure supplement 1b.