. 2020 May 22;9:e51358. doi: 10.7554/eLife.51358

Figure 5. Branched actin assembly directly coupled to p14 cytoplasmic tail drives cell-cell fusion.

(a) Average fusion index of p14 truncation mutants normalized to that of p14 WT. P-values are two-tailed, two-sample Student’s t-test to p14 WT where *** = p<0.001. Error bars indicate standard deviations from 3 independent transfections of 3 wells each (See also Figure 5—figure supplement 1a, (b,c). (b) Schematic of fusion protein coupling actin assembly to p14 cytoplasmic tail consisting of Grb2 SH2 domain and 47 residues from EspFU. (c) Average percent of p14-expressing cell with 3 or more nuclei in HEK293T WT cells and HEK293T cells overexpressing Grb2 SH2 domain and SH2-R47. P-values are two-tailed, two-sample Student’s t-test where ** = p<0.01 and n.s. = p>0.05. Error bars represent standard deviations from 3 independent transfections (See also Figure 5—figure supplement 1d,e,f,g, and Figure 5—source data 1).

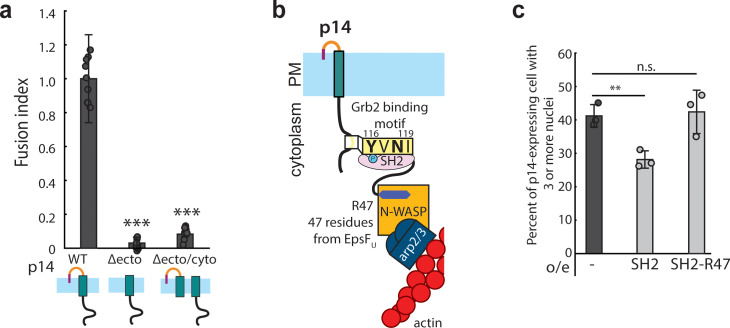
Figure 5—source data 1. Excel Spreadsheet of counts and distribution for p14-expressing HEK293T cells over-expressing R47 constructs for Figure 5c.

Figure 5.

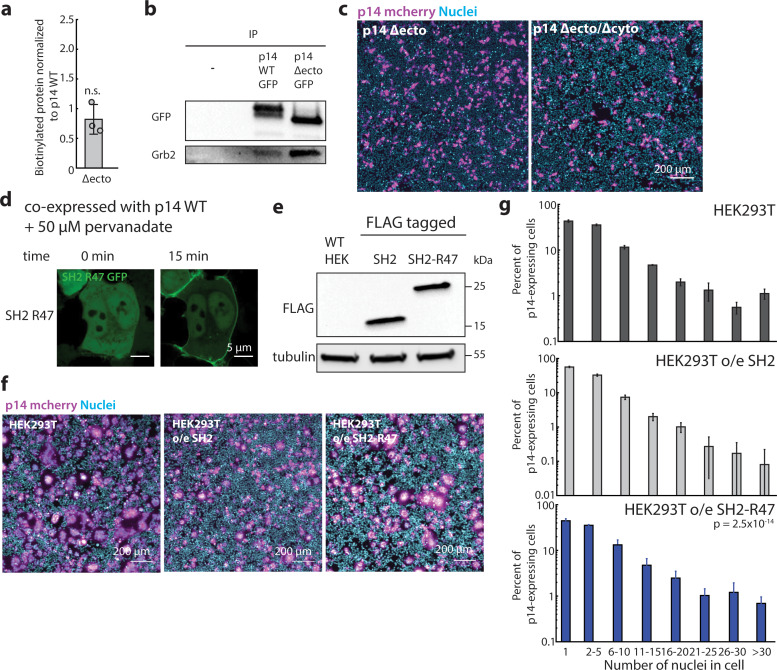
Figure 5—figure supplement 1. Characterization of p14 Δectodomain and direct coupling of p14 to actin assembly.

Figure 5—figure supplement 1.

(a) Average biotinylated p14 Δecto to that of p14 WT. Error bars represent standard deviations from three independent transfections and biotinylation. P-values are two-tailed two-sample Student’s t-test to p14 WT where n.s. = p>0.05. Representative western blot is in Figure 1—figure supplement 1g. (b) Western blot of co-immunoprecipitation of p14 Δectodomain and p14 WT with Grb2. (c) Representative field of view of HEK293T cells expressing p14 WT and p14 truncation mutants with p14 labeled with C-terminus mcherry (magenta) and nuclei stained with Hoechst 33342 (cyan). (d) Representative confocal images of HEK293T cells over-expressing SH2-47 residues from EpsFu tagged with GFP and p14 WT mcherry (not shown) before and after addition of pervanadate to phosphorylate p14. (e) Western blot of HEK293T cells over-expressing FLAG-tagged SH2 and SH2-47 residues from EpsF(U). (f) Representative field of view of HEK293T cells and HEK293T cells over-expressing SH2 and SH2-47 residues from EpsF(U) transfected with p14 WT with p14 labeled with C-terminus mcherry (magenta) and nuclei stained with Hoechst 33342 (cyan). (g) Average nuclei count of p14-expressing in HEK293T cells and HEK293T over-expressing SH2 and SH2-R47. P-values are ks-test and error bars represent standard deviation from 3 independent transfections.
Figure 5—figure supplement 1—source data 1. Excel Spreadsheet of surface biotinylation of p14-WT-GFP and p14-Δecto-GFP for Figure 5—figure supplement 1a.

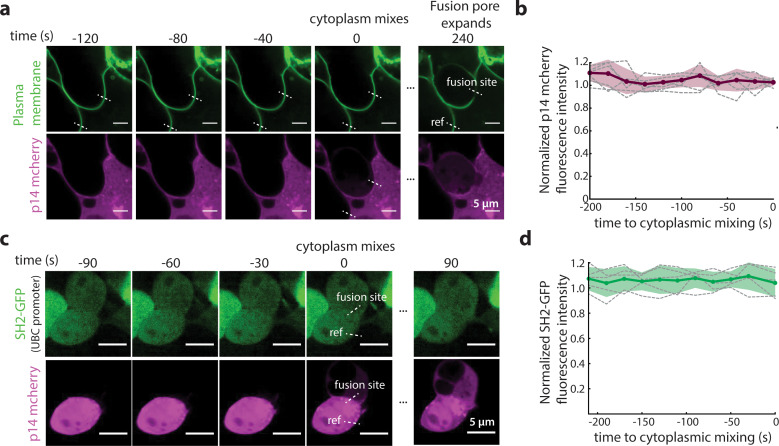
Figure 5—figure supplement 2. Characterization of p14 at time and site of fusion.

Figure 5—figure supplement 2.

(a) Representative fluorescence images of a fusion site 120 s prior to cytoplasmic mixing. Plasma membrane is marked with GPI-anchored pHluorin (green) and p14-WT mCherry in magenta. Dotted white lines mark the fusion site and a reference membrane site where p14-WT mCherry fluorescence intensity is normalized to. (b) Normalized p14-WT mCherry fluorescence intensity at the fusion site 200 s prior to cytoplasmic mixing for 6 fusion events. Bolded line is average normalized intensity and filled in area are the standard deviations. (c) Representative snapshots of a fusion site 90 s prior to cytoplasmic mixing. SH2-GFP (green) and p14-WT mCherry in magenta. Dotted white lines mark the fusion site and a reference membrane site where SH2-GFP fluorescence intensity is normalized to. (d) Normalized SH2-GFP fluorescence intensity at the fusion site 210 s prior to cytoplasmic mixing for 5 fusion events. Bolded line is average normalized intensity and filled in area are the standard deviations.
Figure 5—figure supplement 2—source data 1. Excel Spreadsheet of normalized intensity of p14-WT-mCherry and SH2-GFP at fusion site ~200 s prior to fusion for Figure 5—figure supplement 2b and d.