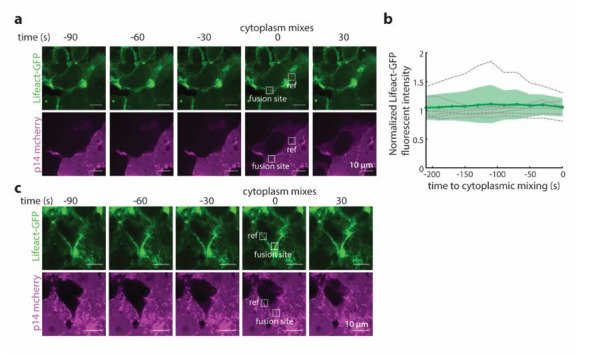
Author response image 4. Time-lapse imaging of p14 and actin at times and sites of fusion.

(a) Representative snapshots of a fusion site 90 sec prior to cytoplasmic mixing. Actin is visualized with Lifeact-GFP(green) and p14-WT mCherry in magenta. Boxed region marks the fusion site, where the average lifeact-GFP fluorescence intensity is quantified and normalized to the fluorescence intensity at a reference site on the plasma membrane. Representative fluorescent images of a fusion site 90 sec prior to cytoplasmic mixing. Actin is visualized with Lifeact-GFP(green) and p14-WT mCherry in magenta. Boxed region marks the fusion site, where the average lifeact-GFP fluorescence intensity is quantified and normalized to the fluorescence intensity at a reference site on the plasma membrane. (b) Normalized lifeact-GFP fluorescence intensity at the fusion site 210 sec prior to cytoplasmic mixing for 7 fusion events. Bolded line is average normalized intensity and filled in areas are the standard deviations. (c) Fluorescent images of a fusion site 90 sec prior to cytoplasmic mixing where Lifeact-GFP fluorescence intensity is enriched at the fusion site.
