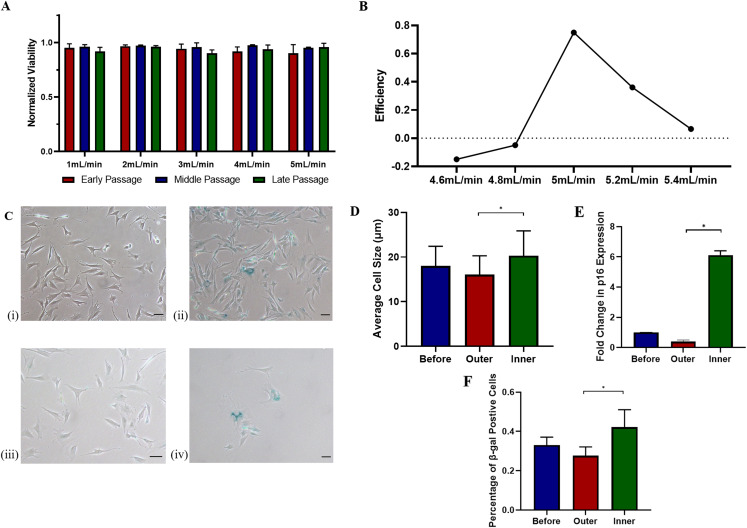
FIG. 4.
(a) Normalized viability of H2O2-treated mMSCs from different passage numbers collected at the outlet under different flow rates (n = 3). (b) The efficiency of the spiral microfluidics under different flow rates. (c) SA-βgal staining on mMSCs (i) Normal mMSCs without senescence induction. (ii) Induced senescent mMSCs before isolation. (iii) Induced senescent mMSCs collected from the outer outlet after isolation. (iv) Induced senescent mMSCs collected from the inner outlet after isolation. (d) Average sizes of the induced senescent mMSCs collected before and after isolation at the optimal flow rate. (e) qPCR on p16 expression from induced senescent mMSCs collected before and after isolation at the optimal flow rate. (f) Percentage of SA-βgal positive cells collected before and after isolation at the optimal flow rate. Scale bar: 50 μm. *p < 0.01.

