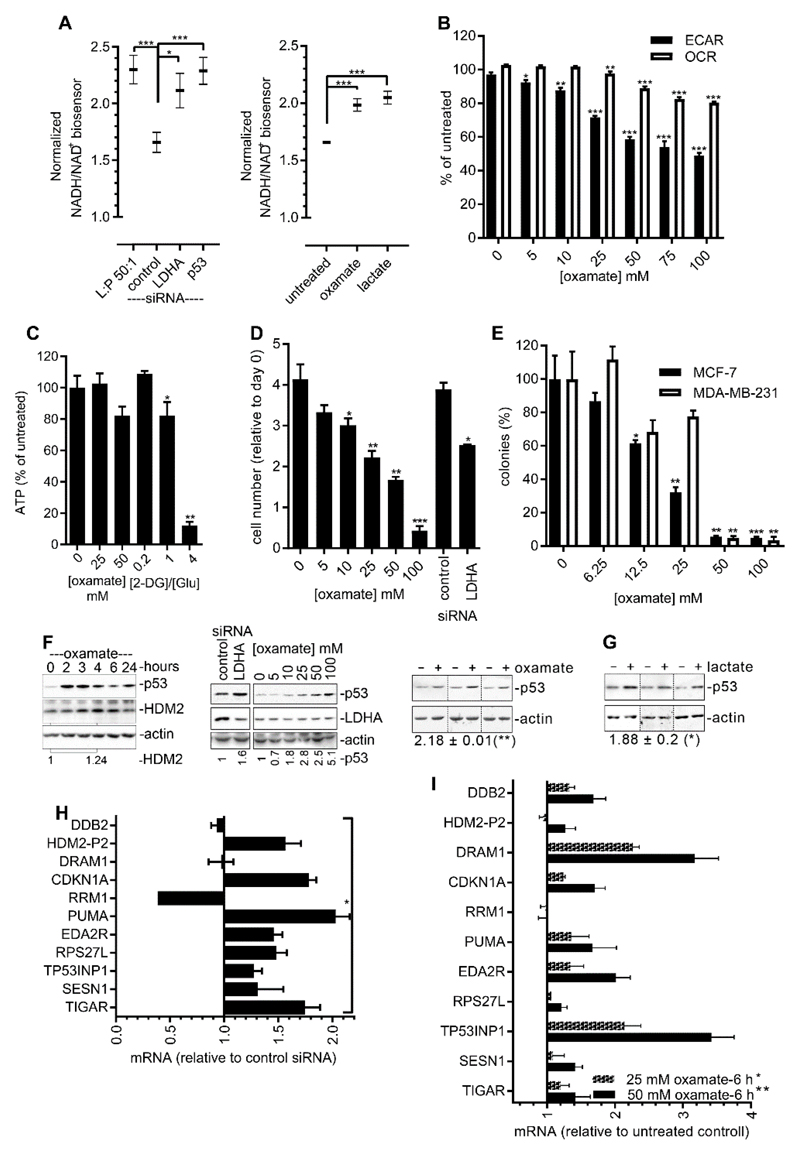
Fig. 3. Inhibition of LDH activates p53.
(A) NADH/NAD+ ratios in MCF-7GLU cells were measured using the Peredox biosensor. Left: Forty-eight hours after transfection with the indicated siRNAs. Data from control siRNA–transfected cells 6 min after the addition of 50 mM lactate to the medium (L:P 50:1) are included as a positive control. Right: No transfection with siRNA. The cells were imaged as described earlier, and 6 min after the addition of medium containing 50 mM sodium oxamate or 50 mM lactate, the fold change in green/red ratio was determined. Control, medium alone added. Data in both panels are means ± SEM of at least 35 cells from a representative of two or more experiments and were analyzed by unpaired t test. (B) The effect of increasing concentrations of sodium oxamate on ECAR and OCR in MCF-7 cells was determined using Seahorse XF96. Data are means ± SEM of four experiments. Data were analyzed by unpaired t test and compared to the 0 mM control. (C) ATP was measured in MCF-7GLU cells in 25 mM glucose (Glu) 2 hours after the initiation of treatment with oxamate or 2-deoxyglucose (2-DG). Data are means ± SEM of three experiments and were analyzed by paired t test compared to the 0 mM control. (D) MCF-7GLU cells were transfected with the indicated siRNAs or were continuously exposed to the indicated concentrations of sodium oxamate, and the effect on proliferation was determined at 72 hours. Data are means ± SEM of three experiments and were analyzed by unpaired t test compared to either the 0 mM oxamate condition or to the control siRNA. (E) Cells were plated as single cells at a low density and exposed to the indicated concentrations of sodium oxamate for 10 days before colonies were counted. Data are means ± SEM of three experiments and were analyzed by unpaired t-test and compared to the 0 mM oxamate condition. (F) MCF-7GLU cells. Left: Western blotting analysis of p53 and HDM2 protein abundance during exposure to 50 mM sodium oxamate for the indicated times. Data are representative of two experiments. Middle: Western blotting analysis of p53 protein abundance after 2 hours of exposure to the indicated concentrations of sodium oxamate or 48 hours after transfection with control of LDHA-specific siRNA. Right: Western blotting analysis of p53 abundance in three biological replicates (separated by vertical dotted lines) after 2 hours of exposure to 50 mM sodium oxamate. Numbers under the blot indicate the mean ± SEM of the relative intensity of the p53 bands in the oxamate-treated cells compared to that in the untreated cells, which was set at 1. Data were analyzed by paired t test. (G) MCF-7GLU cells (three biological replicates separated by vertical dotted lines) were cultured as described in (A) for 6 hours in the absence or presence of 50 mM lactate before being analyzed by Western blotting for p53 abundance. Numbers under the blot indicate the mean ± SEM of the relative intensity of the p53 bands in the lactate-treated cells compared to that in the untreated cells, which was set at 1. Data were analyzed by paired t test. (H) RT-qPCR analysis of mRNAs extracted from MCF-7GLU cells in which LDHA was knocked down by LDHA-specific siRNA. Samples were analyzed 72 hours after transfection. Data are means ± SEM of three experiments. Knockdown of LDHA protein by the specific siRNA is shown in fig. S3. (I) RT-qPCR analysis of mRNAs extracted from MCF-7GLU cells in which LDH was inhibited by treatment with the indicated concentrations of sodium oxamate for 6 hours. Data are means ± SEM of three experiments.

