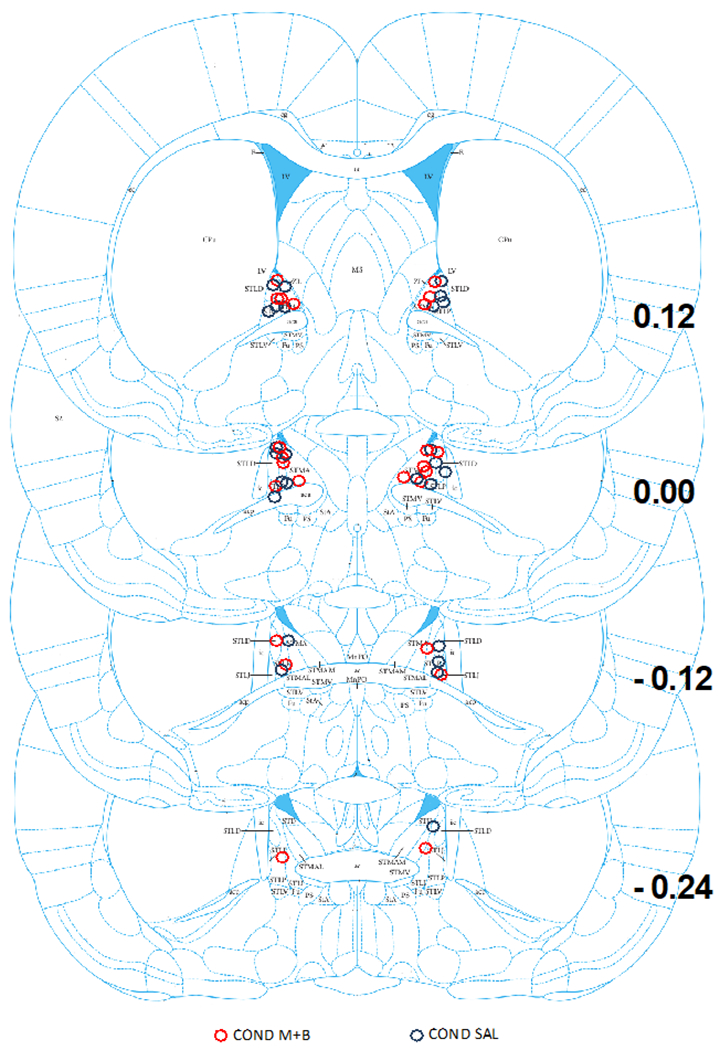
Figure 3. Cannula Placements within the BNST for Experiment 2.

This figure is a schematic of all the microinjector placements within the BNST for Experiment 2 across bregma coordinates 0.12 to −0.24. Red circles represent M+B BNST treatment and blue circles represent saline treatment.
