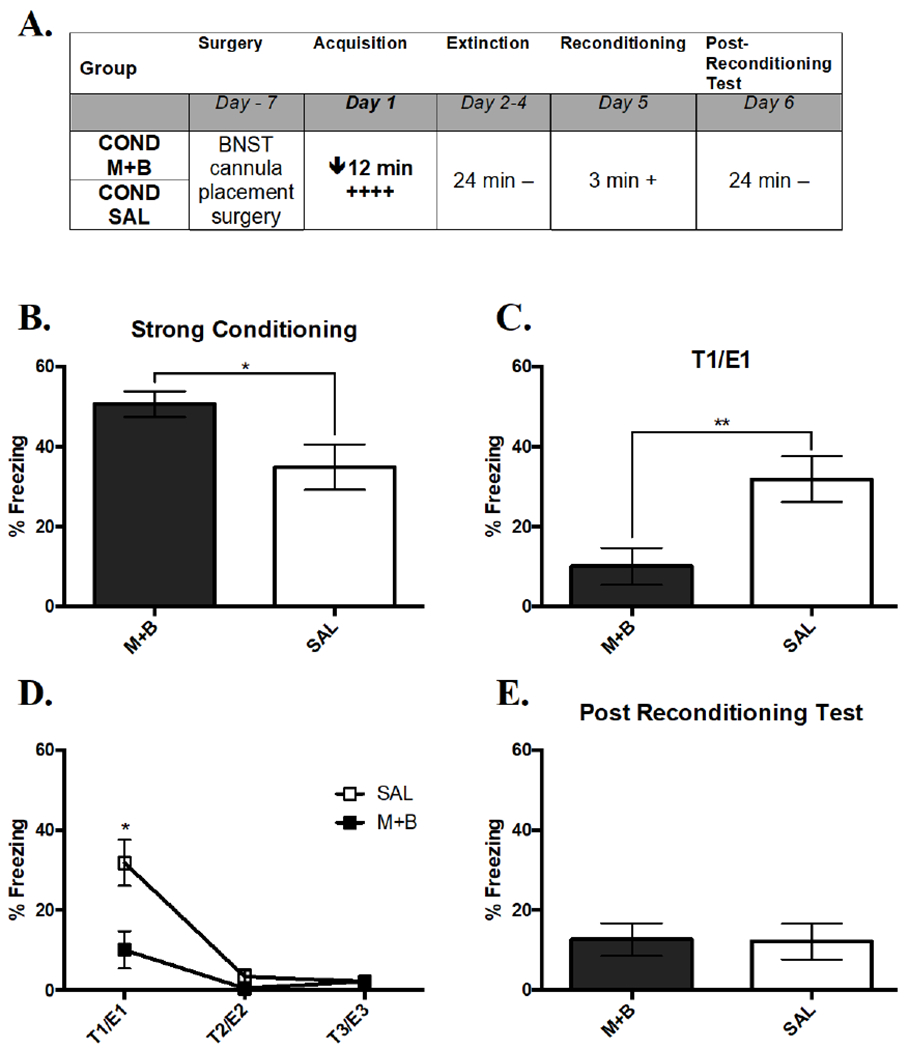
Figure 4. Inactivation of the BNST Prevents Strong Acquisition.

(A) Overall design of Experiment 2. The times listed represent the total time of exposure to the context for a given session. A plus sign indicates a single .75 mA shock and a minus sign indicates exposure to the context without shock. (B) Mean percent freezing during acquisition of strong conditioning with an active or inactive BNST. An inactive BNST enhanced freezing. (C) Mean percent freezing during the expression of acquisition in the test on Day 2, where retention of acquisition was impaired by an inactive BNST during conditioning (D) Extinction curve on Days 2 through 4 as shown by a line graph of both groups’ decreasing average percent time freezing. (E) Mean percent freezing during the test of reacquisition on Day 6 that was unaffected by initial acquisition differences. Significance between groups is represented by *** p < .001; ** p < .01; * p < .05. COND SAL, n = 12; COND M+B, n = 14. Error bars represent standard error of the mean.
