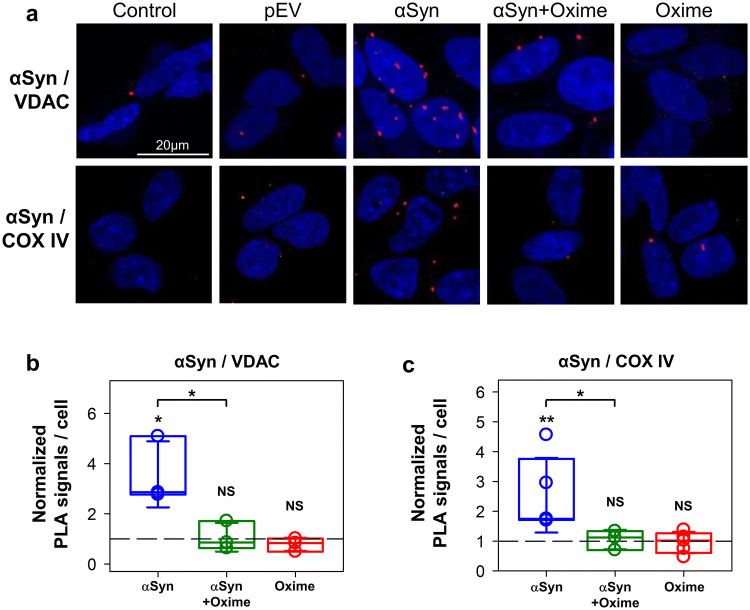
Fig. 2.
Effect of olesoxime on αSyn localization at the mitochondrial membranes. a Representative confocal images of PLA showing αSyn in close proximity (~ 30 nm) to VDAC at the MOM and with Complex IV (COX IV) at the MIM in cells overexpressing αSyn before and after olesoxime treatment. The nuclei are stained in blue (DAPI) (× 63 objective, scale bar 20 µm). Controls omitting the primary antibodies are shown for each pairwise combination. b, c Box plots represent the normalized distribution of signals per cell, obtained from an average of 160 cells per experiment with a minimum of 60. Error bars indicate SD. The PLA signals were normalized to the average PLA values in pEV control cells of the corresponding experiment. The dashed lines indicate pEV controls. At least 3 independent experiments were performed for each pairwise of antibodies. Unless indicated by brackets, significance was tested against the corresponding pEV controls (**p < 0.01, *p < 0.05, NS (not significant): p > 0.5; one-way ANOVA)

