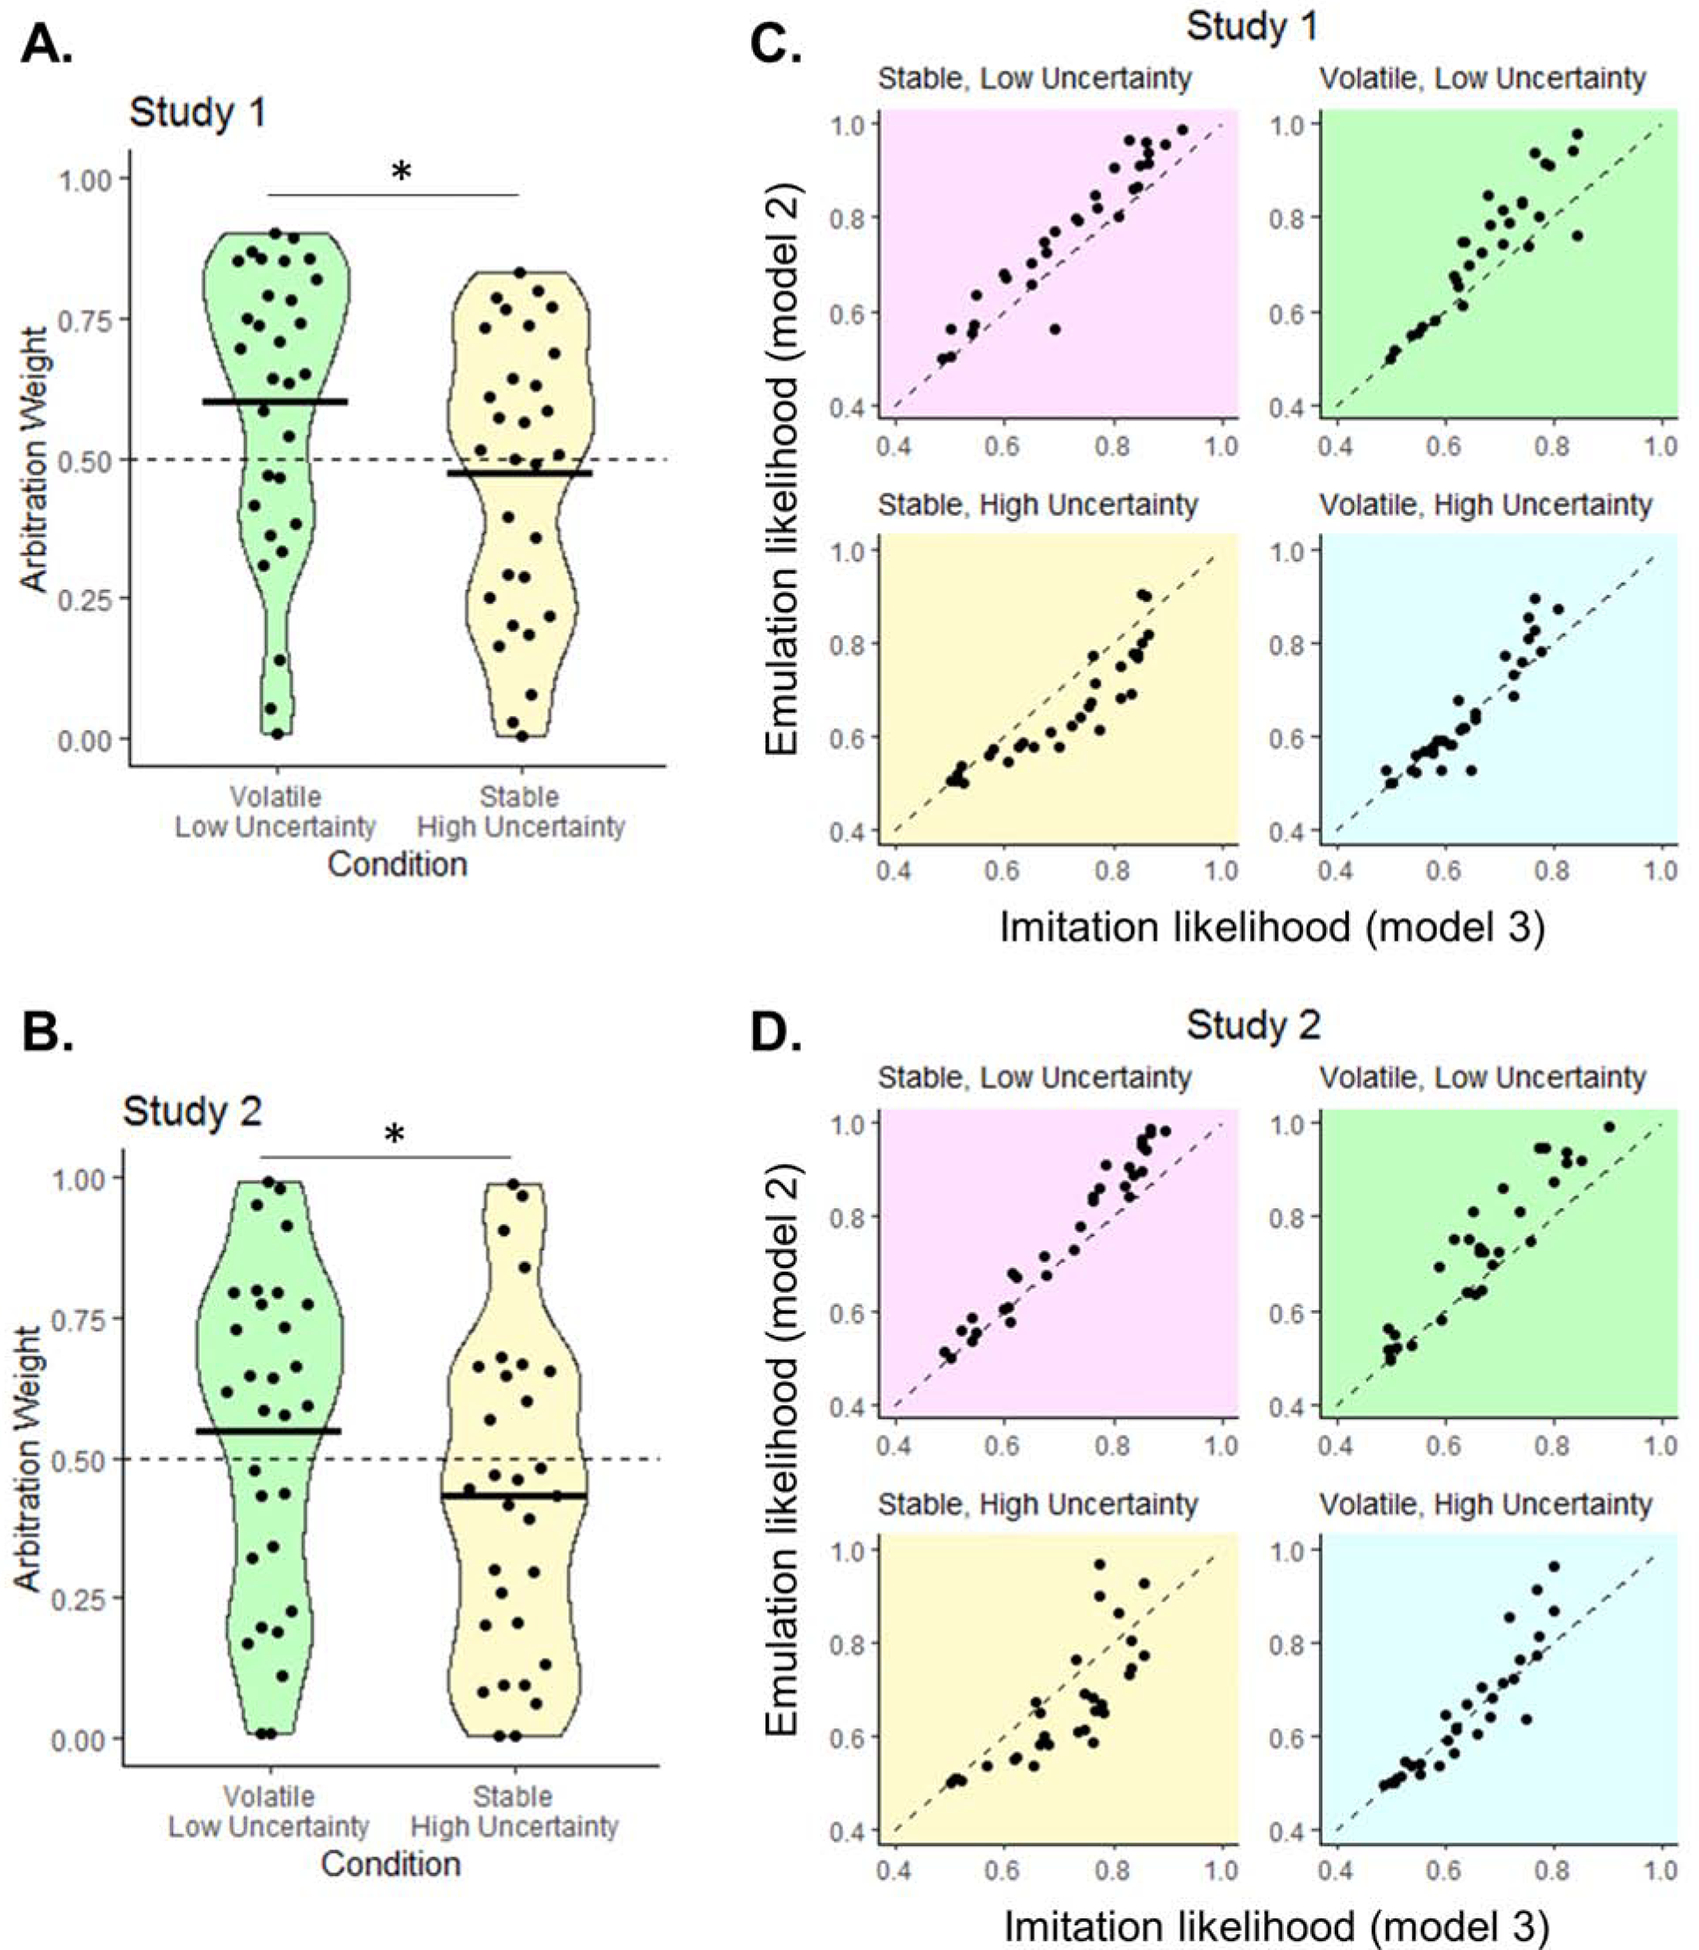
Figure 3. Modulation of arbitration by volatility and uncertainty.

(A–B) Arbitration weight values ω (probability of relying on emulation over imitation), were extracted from the winning arbitration model for each trial and averaged for each subject and condition. The plots show, for Study 1 (A) and Study 2 (B), mean and distribution of ω for two conditions of interest: volatile/low uncertainty trials (green), and stable/high uncertainty trials (yellow). Dots represent individual subjects; the black bar the mean. T-test: *P<0.0001. (C-D) Mean per-trial emulation (Model 2) and imitation (Model 3) likelihood, plotted against each other separately for the 4 task conditions. In both Study 1 (C) and Study 2 (D), most participants favor emulation (dots above the diagonal) when uncertainty is low (green & pink plots) but favor choice imitation (dots below the diagonal) when the environment is stable and uncertainty is high (yellow plot).
