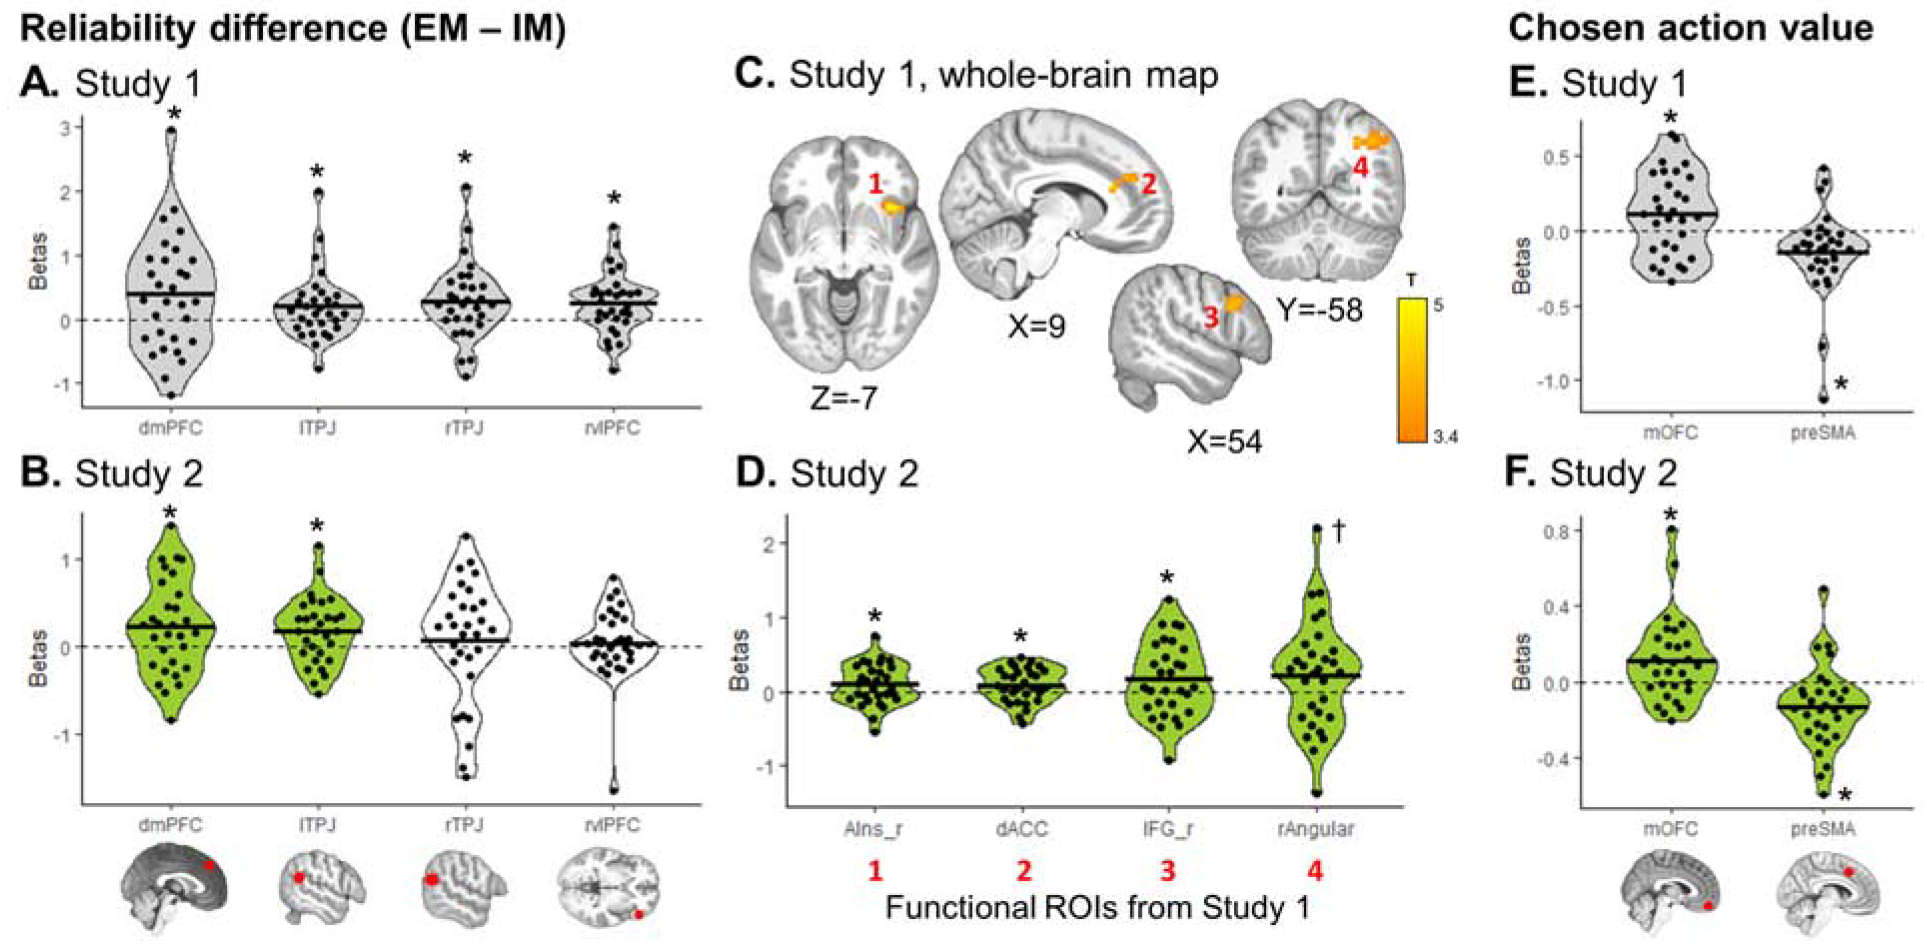
Figure 4. Arbitration signals, pre-registered analyses.

Reliability difference (A–D) and chosen action value (E–F) signals were extracted from each pre-registered ROI. (A, E) Regions with significant signals in Study 1 (grey) were selected as hypotheses for Study 2. (C) Whole-brain map for the reliability difference signal was also examined in Study 1, with a cluster-forming threshold of P<0.001 uncorrected, followed by cluster-level FWE correction at P<0.05. Significant clusters were saved as functional ROIs to be examined in Study 2. No cluster survived correction for chosen value. (B, D, F) Green plots represent significant effects in Study 2, confirming a priori hypothesis from Study 1. White plots represent hypotheses not confirmed in Study 2. Dots represent individual subjects; the black bar the mean beta estimate. T-tests: * P<0.05, † P=0.052.
