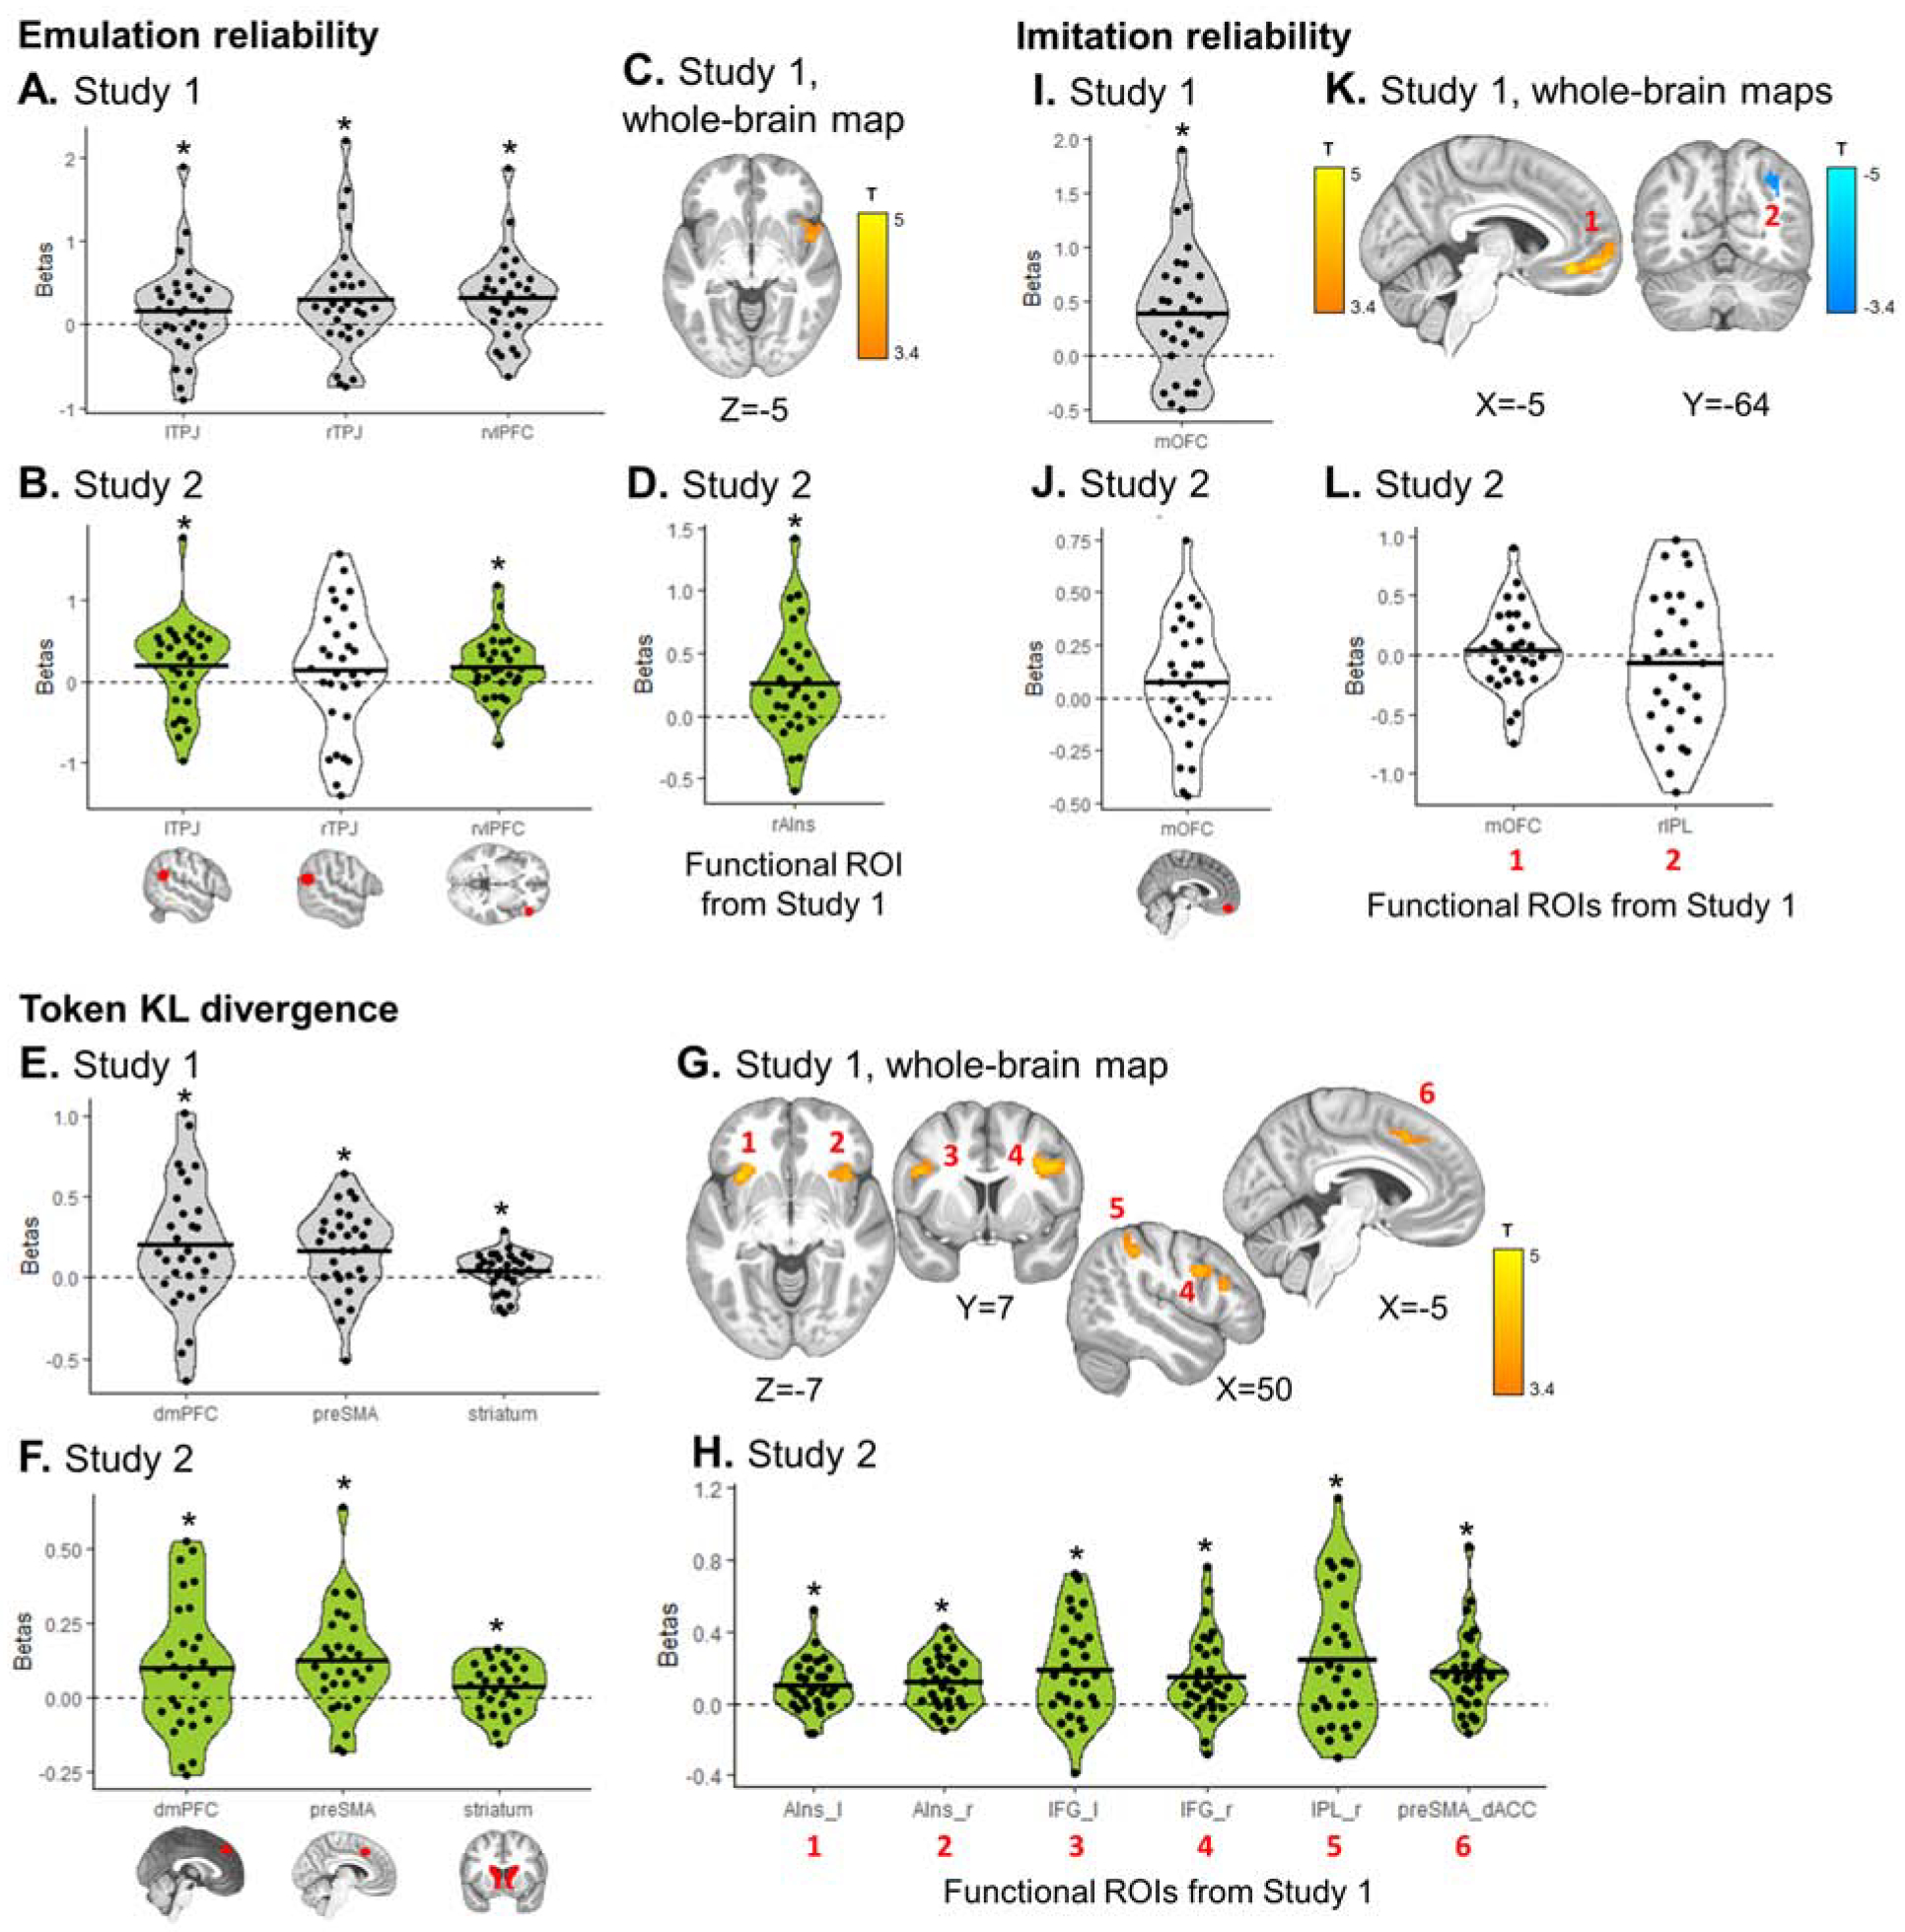
Figure 5. Emulation and imitation signals, pre-registered analyses.

Emulation reliability (A–D), update in token values (E–H), and choice imitation reliability (I–L) signals extracted from each pre-registered ROI. (A, E, I) Regions with significant signals in Study 1 (grey) were selected as hypotheses and a priori ROIs for Study 2. (C, G, K) Whole-brain maps were examined in Study 1, with a cluster-forming threshold of P<0.001 uncorrected, followed by cluster-level FWE correction at P<0.05. Significant clusters were saved as functional ROIs to be examined in Study 2. (B, D, F, H, J, L) Green plots represent significant effects in Study 2, confirming the a priori hypothesis from Study 1. White plots represent hypotheses that were not confirmed in Study 2. Dots represent individual subjects; the black bar the mean beta estimate. T-tests: * P<0.05.
