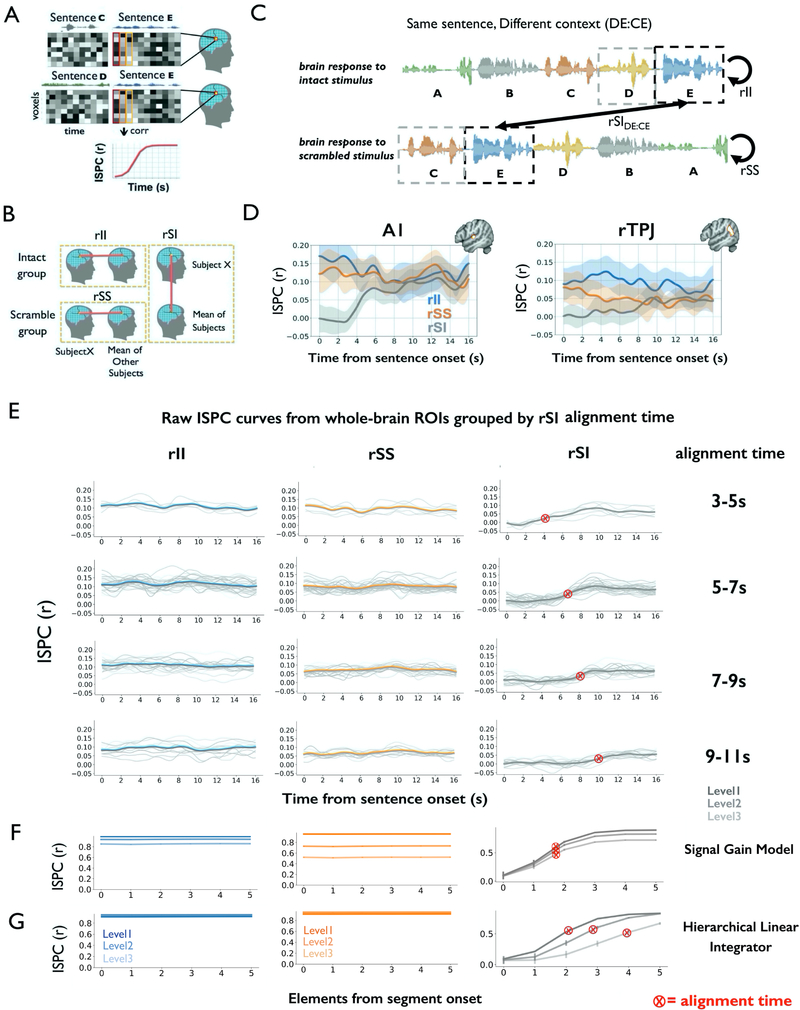
Figure 2. Gradual alignment of responses to a common stimulus preceded by different context.
(A) For each sentence, inter-subject pattern correlation (ISPC) was measured by correlating the spatial pattern of activation at each time point across the two groups. (B) ISPC was calculated between one subject and the average of the rest of the subjects within the intact group (rII); or between one subject and the rest of the scrambled group (rSS); or across the intact and scrambled groups (rSI). (C) ISPC analysis for the same sentence preceded by different contexts (DE:CE). Here, sentence E followed sentence D for the Intact group, but it followed sentence C for the Scrambled group. (D) Average ISPC for all sentences in ROIs within an auditory (A1+) region and a right TPJ region. Shaded area indicates a 95% confidence interval on individual rSI estimates. (E) The rII, rSS, and rSIDE:CE curves are shown for individual regions, grouped by “alignment time”. The individual region curves are pale gray, while mean curves for each group of regions is in thick blue (rII), orange (rSS), and gray (rSIDE:CE). Note that the rII and rSS curves do not ramp, neither for the mean curve, nor for individual regions, while the rSI curves show ramping in almost all regions. (F) Simulation of rII, rSS and rSI for the signal gain model. The rSI curves exhibit ramping, but the alignment times are stable across levels. (G) Simulation of, rSS and rSI for the HLI model. The alignment time is greater in higher levels of the HLI model. A1 = primary auditory cortex, rTPJ = right temporal-parietal junction.

