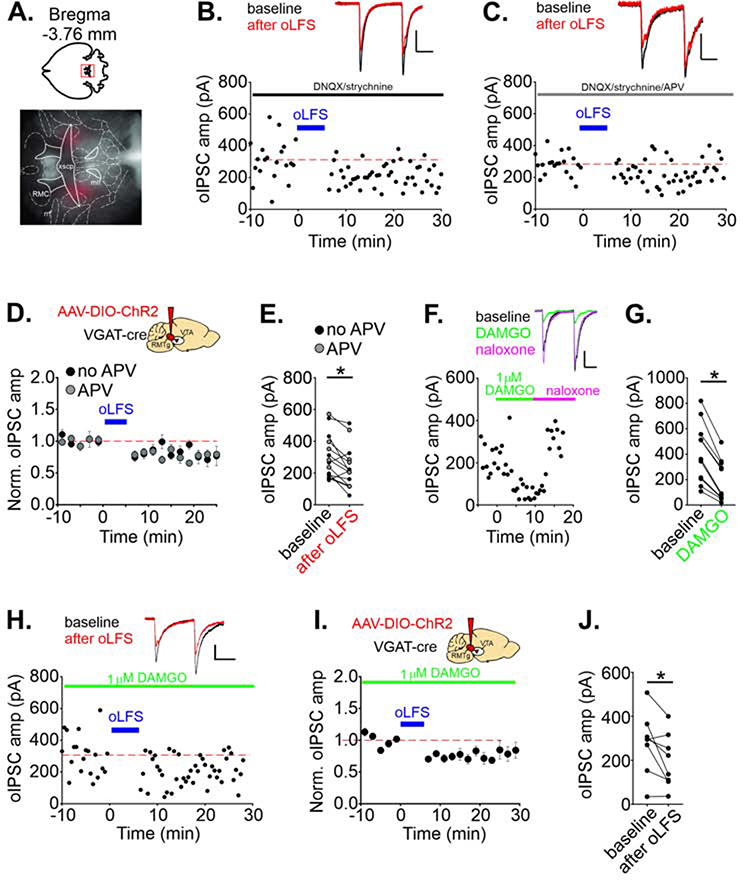
FIGURE 1. RMTgGABA→VTA synapses exhibit LTD even in DAMGO.
A. Representative viral injection in the RMTg, horizontal section. See Figure S1A for all localizations. B. Representative experiment, LTD of olPSCs in a cell is induced by oLFS of RMTg GABAergic afferents. Blue bars indicate time of oLFS. In this and all other electrophysiological experiments,DNQX/strychnine were included in the bath solution except as noted. C. Representative similar experiment in the presence of the NMDAR antagonist, d-APV. Insets: olPSCs during baseline (black) and 10–20 min after oLFS (red). D. Time course of LTD; averaged olPSC amplitudes before and after oLFS (n = 13 cells). E. Mean olPSC amplitudes for each cell comparing a 10 min baseline period and a period from 10–20 min after oLFS (p = 0.018, paired t-test). In all subsequent figures, d-APV was included in the bath solution. F. Representative experiment, 1 μM DAMGO bath application depresses olPSCs; 2 μM naloxone reverses this. G. Mean olPSC amplitudes before and in DAMGO (p < 0.0001, paired t-test) (n = 11 cells). H. Representative experiment, oLFS induces LTD in 1 μM DAMGO. I. Time course of averaged olPSC amplitudes for each cell before and after oLFS in 1 μM DAMGO (n = 8 cells/mice), and J. mean olPSC amplitudes during a 10 min baseline and 10–20 min after oLFS in DAMGO (p = 0.03, paired t-test). Data are represented as mean ± SEM. Calibrations: 100 pA, 20 ms. *p < .05, paired t-test of amplitude of 10 min baseline vs.10–20 min after oLFS. See also related Supplemental Figure 1.

