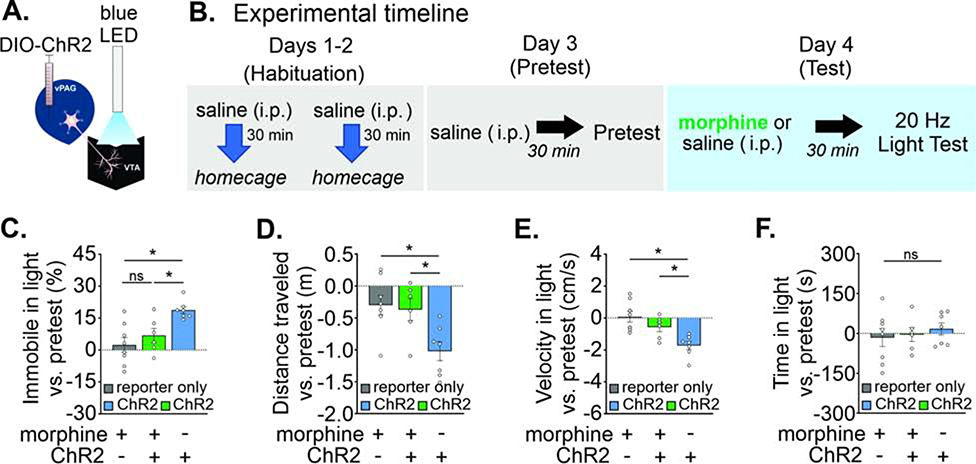
FIGURE 5. Morphine blocks vPAGGABA→VTA stimulation-induced immobility.
A. Diagram: LED stimulation of PAGGABA terminals in the VTA. B. Experimental timeline of real time place preference procedure with morphine or saline pre-treatment. C. Time spent immobile increased in ChR2 mice receiving saline, but morphine blocked this (n = 8 reporter only, n = 6 morphine + ChR2, n = 7 saline + ChR2 mice, Dunnett’s multiple comparisons, reporter only + MOR vs. opsin + MOR: p = 0.56, reporter only + MOR vs. opsin + SAL: p = 0.002). D. A corresponding decrease in distance traveled in the apparatus was observed only in ChR2 mice receiving saline (Dunnett’s multiple comparisons, reporter only + MOR vs. opsin + MOR: p = 0.95, reporter only + MOR vs. opsin + SAL: p = 0.009, opsin + MOR vs. opsin + SAL: p = 0.029). E. A corresponding reduced velocity in the light-paired chamber was also observed only in ChR2 mice receiving saline (Dunnett’s multiple comparisons, reporter only + MOR vs. opsin + MOR: p = 0.31, reporter only + MOR vs. opsin + SAL: p = 0.001, opsin + MOR vs. opsin + SAL: p = 0.044). F. Average time spent in the light-paired chamber vs. pretest was unaffected by light stimulation. Data are represented as mean ± SEM. See related Supplemental Figure 5. *p < 0.05, Two-way ANOVA and post hoc Dunnett’s multiple comparisons.

