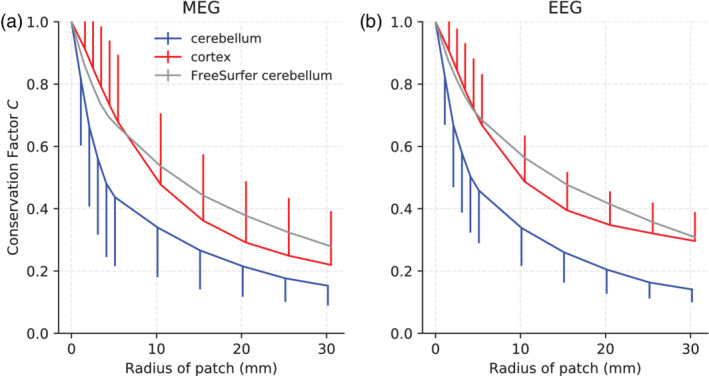
Figure 3.

Conservation factor C estimated by Monte Carlo simulations resulting from activated cortical patches of varying radii and uniform neural current density in the cortex, cerebellum, and the FreeSurfer cerebellum for (a) MEG magnetometers and (b) EEG. For each patch size, the mean conservation factor is plotted. The bars represent one standard deviation and are plotted one‐sided for clarity
