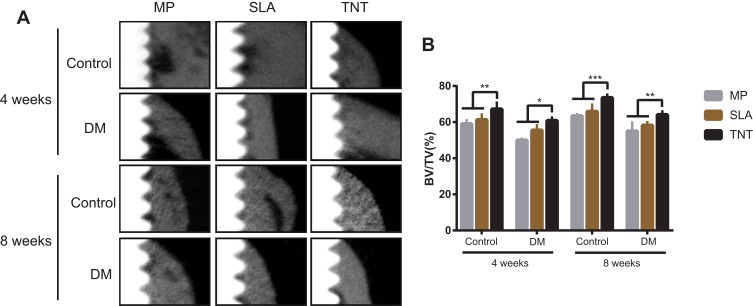
Figure 9.
Osteogenetic ability of Ti implants with different modified surfaces in-vivo. (A) Scanning images of micro-CT after implantation in the DM rat model for 4 and 8 weeks. The white part on the left is the Ti implant, the gray part on the right is the bone tissue, and the black part between the two is the low-density shadow. (B) The BV/TV% of micro-CT after implantation in the DM rat model for 4 and 8 weeks. Results showed that the thickness of the cortical bone around the implants of the DM group was thinner than that in the control group after 4 and 8 weeks of implantation. More dense new bone was observed surrounding the implants with the TNT surface. *p < 0.05, **p < 0.01, ***p < 0.001.

