Fig. 3.
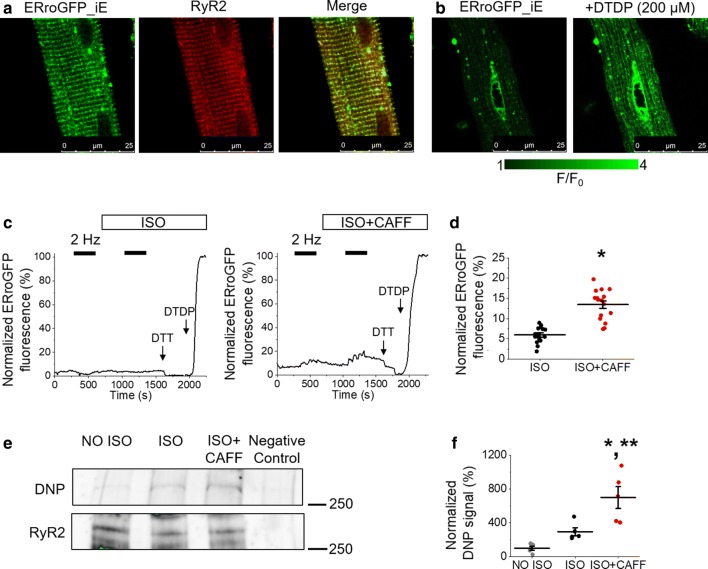
Enhanced RyR2 activity in rat VMs leads to SR oxidative stress and RyR2 oxidation. a Representative images of a cultured rat VM 48 h after adenoviral infection with ERroGFP_iE oxidative stress biosensor (left image, green). Using anti-RyR antibody, VMs were probed for expression of RyR2 (center image, red). A merged image is shown on the right, indicating correct probe localization. b Representative images of infected VM treated with DTDP (200 µmol/L) to achieve maximal fluorescence, demonstrating ERroGFP_iE sensitivity. c Representative traces of ERroGFP_iE fluorescence from infected VMs. Myocytes were paced at 2 Hz for 5 min (black bars) and treated with ISO (50 nmol/L, left trace) or ISO and caffeine (CAFF, 200 µmol/L, right trace). Signal was normalized to minimum fluorescence obtained by application of DTT (5 mmol/L) and maximum fluorescence by application of DTDP (200 µmol/L). The graph in d depicts mean data ± SEM for maximum normalized fluorescence (%) after pacing and application of ISO, or application of ISO and CAFF. N = 3–4 animals, n = 15–16 VMs. *p < 0.05 vs. ISO group, two-sample Student’s t test. e Immunoprecipitated RyR2 from freshly isolated rat VMs was immunoblotted for oxidation using DNP antibody. Representative images of DNP and RyR2 immunoprecipitation signal from VMs without treatment (NO ISO), treated with ISO, or ISO and CAFF. The graph in f depicts quantification of normalized DNP signal (%). N = 5 animals. *p < 0.05 vs. NO ISO group, **p < 0.05 vs. ISO group, one-way ANOVA with Bonferroni post hoc test

