Fig. 6.
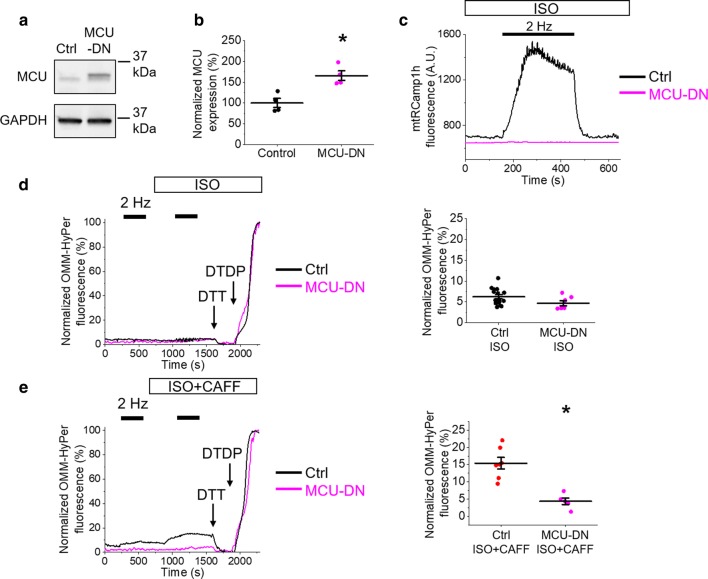
Inhibition of MCU Ca2+ uptake with MCU-DN reduces mito-ROS emission in rat VMs. a Representative western blots from VMs probed for MCU expression. The control lane (Ctrl) represents VMs infected with virus carrying an empty vector, and the MCU-DN lane represents VMs infected with virus carrying the dominant-negative MCU subunit. The graph in b depicts quantification of normalized MCU signal (%). N = 4 animals. *p < 0.05 vs. Ctrl group, two-sample Student’s t test. c Representative traces of mtRCamp1h fluorescence from control virus (black line) or MCU-DN virus (pink line) infected VMs. Myocytes were paced at 2 Hz for 5 min (black bar) after treatment with ISO (50 nmol/L) or ISO and low-dose caffeine (CAFF, 200 µmol/L). No mitochondrial Ca2+ uptake is observed with expression of MCU-DN. d Representative traces of OMM-HyPer fluorescence from infected VMs. Myocytes were paced at 2 Hz for 5 min (black bars), treated with ISO, and paced again at 2 Hz. The black line indicates control VM signal, while the pink line indicates MCU-DN infected VM. The signal was normalized to minimum fluorescence obtained by application of DTT (5 mmol/L) and maximum fluorescence by application of DTDP (200 µmol/L). The graph depicts mean data ± SEM for maximum normalized fluorescence (%) after pacing and application of ISO. N = 3–4 animals, n = 7–16 VMs. *p < 0.05 vs. Ctrl group, two-sample Student’s t test. e Representative traces of OMM-HyPer fluorescence from infected VMs. Myocytes were paced at 2 Hz for 5 min (black bars), treated with ISO and CAFF, and paced again at 2 Hz. The graph in e depicts mean data ± SEM for maximum normalized fluorescence (%) after pacing and application of ISO. N = 3 animals per group, n = 5–7 VMs. *p < 0.05 vs. Ctrl group, two-sample Student’s t test

