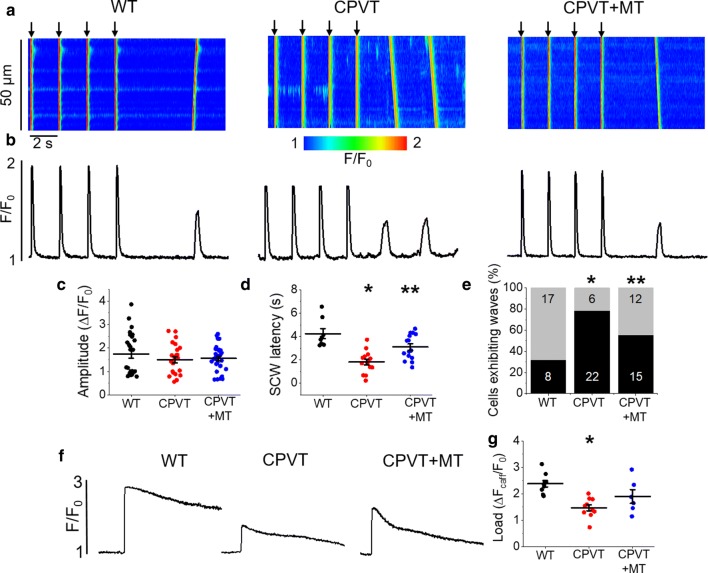
Fig. 7.
Proarrhythmic SCWs in CPVT mice VMs with genetically increased RyR2 activity can be attenuated by mito-ROS scavenging. a Representative confocal line scan images of Ca2+ transients and b Fluo-3 fluorescence (F/F0) profiles of ISO treated (100 nmol/L) WT and CPVT mouse VMs undergoing 0.5 Hz pace-pause protocol (arrows) to induce SCWs. Myocytes from CPVT mice were pretreated with mitoTEMPO (20 µmol/L, 20 min, CPVT + MT group). Graphs in cand d depict mean data ± SEM for WT, CPVT and CPVT + MT groups of Ca2+ transient amplitude (ΔF/F0) and SCW latency (seconds), respectively. N = 3 WT, 5 CPVT animals, n = 12–16 VMs. *p < 0.05 vs. WT group, **p < 0.05 vs. CPVT group, one-way ANOVA with Bonferroni post hoc test. e Graph depicting the percentage (%) of cells exhibiting waves. N = 3 WT, 5 CPVT animals, n = 20–25 VMs. *p < 0.05 vs. WT group, **p < 0.05 vs. CPVT group, Fisher’s exact test with Freeman-Halton extension. f Representative Fluo-3 fluorescence profiles (F/F0) of caffeine-induced Ca2+ transients (10 mmol/L) used to determine SR Ca2+ content. The graph in g depicts mean data ± SEM of caffeine-sensitive SR Ca2+ content (ΔF/F0). N = 3 WT, 3 CPVT animals, n = 4–8 VMs. *p < 0.05 vs. WT group, one-way ANOVA with Bonferroni post hoc test

