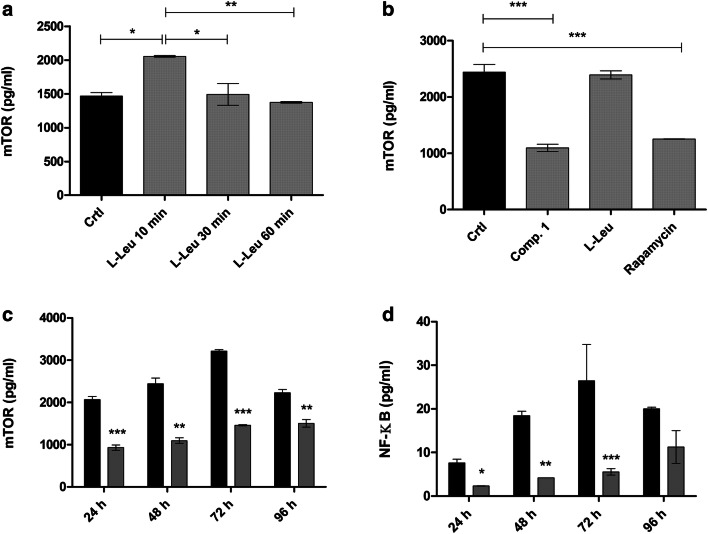
Fig. 7.
Effects of a 5 mM l-Leu on mammalian target of rapamycin (mTOR) total amount after 10, 30 and 60 min, b 100 µM LAT1-inhibitor 1, 5 mM l-Leu and 1 µM rapamycin on mTOR total amount after 48 h incubation, c 100 µM LAT1-inhibitor 1 (grey bars) on mTOR total amount after incubation of 24, 48, 72 and 96 h (control represented as black bars), and d 100 µM LAT1-inhibitor 1 (grey bars) on the total amount of NF-ƘB after incubation for 24, 48, 72 and 96 h (control represented as black bars), data are presented as mean ± SD (n = 3) and an asterisk denotes a significant difference from the respective control (*P < 0.05, **P < 0.01, ***P < 0.001, one-way ANOVA, followed by Tukey’s test)

