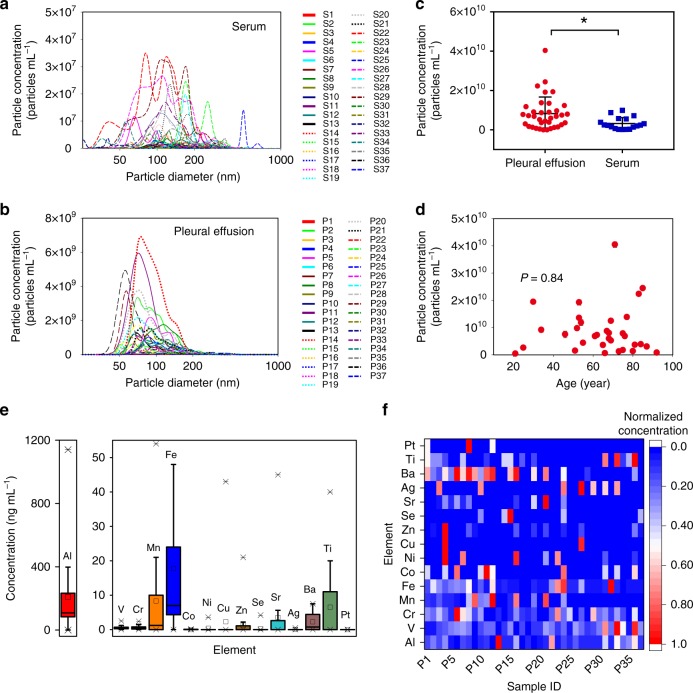
Fig. 1. Concentration, size distribution, biological effect, and elemental fingerprints of NPs in human serum and pleural effusion.
a Concentration and size distribution of NPs in human serum samples. b Concentration and size distribution of NPs in human PE samples. c Comparison of particle concentrations in serum and PE. *P = 0.0002 (unpaired Student’s two-tailed t test). Error bars represent mean ± s.d. (n = 37). d Correlation of particle concentration in PE with the age. P = 0.84 (F test in linear regression analysis; n = 37). e–f Elemental concentration ranges e and heating map f of normalized elemental fingerprints of the NPs extracted from 37 human PE samples (n = 37). In e bounds of the box spans from 25% to 75% percentile, center line represents median, and whiskers visualize 5% and 95% of the data points. The high-abundance elements in organisms (e.g., C, H, O, N, S, P, Na, K, Ca, Mg, and Cl) are not shown. Source data are provided as a Source Data file.

