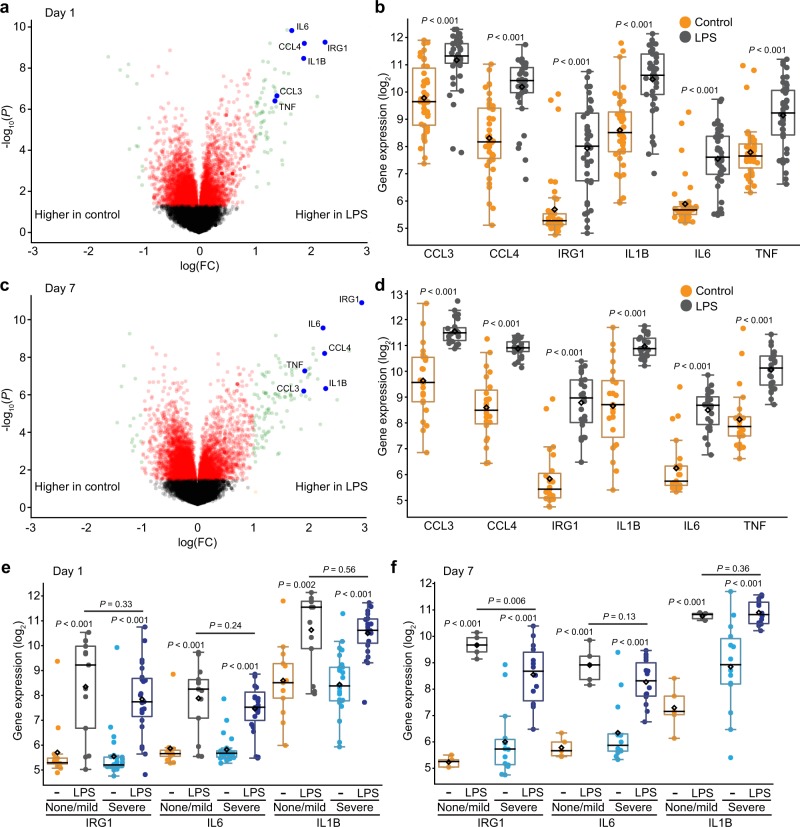
Fig. 2. Innate immune function in preterm lung macrophages.
a–d Differential gene expression in tracheal aspirate macrophages following activation with E. coli LPS (250 ng/ml) for 4 h. a Volcano plot of day 1 samples (n = 42). b Boxplots showing data for LPS-stimulated genes CCL3, CCL4, IRG1, IL1B, IL6, and TNF. c and d LPS response in samples obtained from patients at day 7 of life, including expression of selected LPS-stimulated genes (n = 23). e and f LPS-stimulated expression of IRG1, IL6, and IL1B in samples obtained from patients with severe BPD vs. none/mild BPD at day 1 (e) and day 7 (f) of life (n = 13 for day 1 none/mild BPD; n = 25 for day 1 severe BPD; n = 5 for day 7 none/mild BPD; n = 14 for day 7 severe BPD). P values calculated by Welch Two Sample t-test (unpaired, two-tailed).

