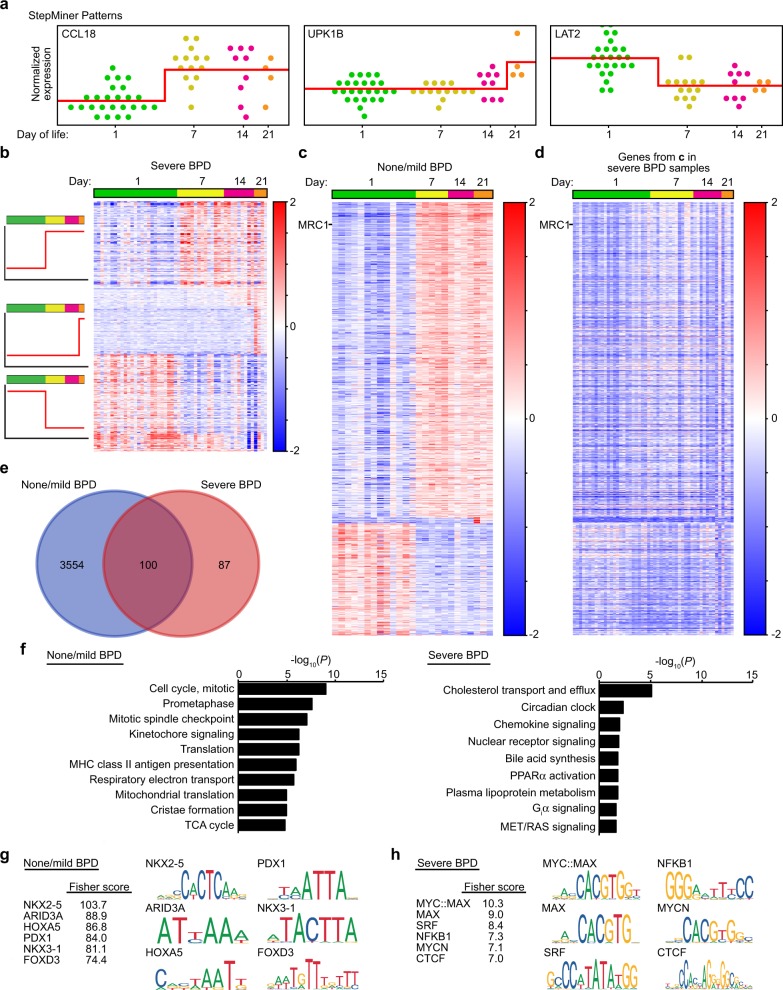
Fig. 5. Temporal dynamics of gene expression in patients resilient to BPD or with severe disease.
a StepMiner analysis was used to identify distinct Boolean patterns of gene expression in patient macrophages over the first 21 days of life. Each point represents a distinct control (not LPS treated) patient sample. Analysis results shown for normalized expression of genes representative of distinct patterns in severe BPD patients. b and c Heat map analysis of the genes displaying time-dependent changes in patients with severe BPD (b) or patients with none or mild BPD (c). d To illustrate the unique temporal pattern of expression in patients with no BPD or mild BPD, expression of genes from c were plotted for patients with severe BPD. e Venn diagram showing that only 100 genes out of 3654 identified in patients with none or mild BPD also had time dependent expression changes in severe BPD patients. f Reactome analysis of time-dependent genes from b, c. g, h Transcription factor motif analysis of genes enriched in patients with none/mild BPD compared to patients with severe BPD. Gene lists generated from StepMiner analysis of control samples from patients with none/mild BPD (g) and severe BPD (h) were analyzed for over represented motifs using oPOSSUM 3.0. Top six motifs based on Fisher score are shown for each group along with graphical representation of their consensus motif. (For severe BPD, n = 25 on day 1, n = 14 on day 7, n = 9 on day 14, n = 4 on day 21; for none/mild BPD, n = 13 on day 1, n = 5 on day 7, n = 4 on day 14, n = 3 on day 21).

