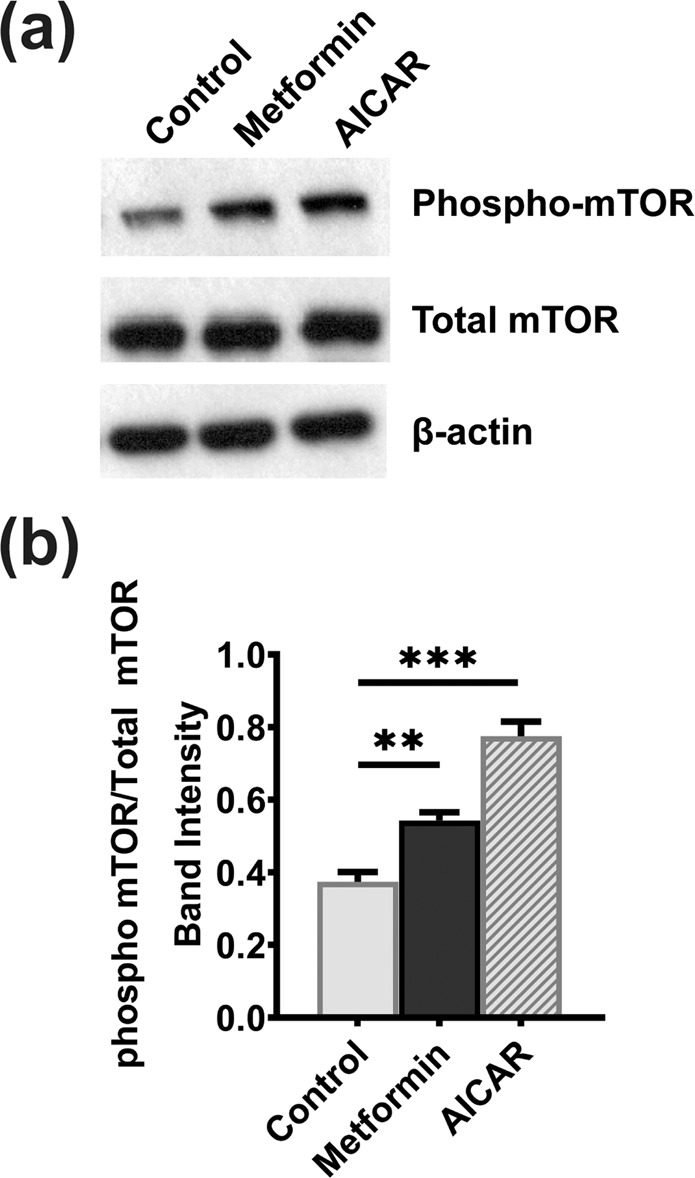
Figure 6.

mTOR phosphorylation in HepG2 cells in response to treatment of the cells with metformin and AICAR. HepG2 cells were treated with 1 mM AICAR or 10 mM metformin for 24 h while culturing the cells in 5-mM glucose medium. (a) Western blot analysis depicting the phospho-mTOR (Ser-2448) in cell lysates from control and treated HepG2 cells. (b) Intensities of bands that correspond to the phospho-mTOR levels normalized to the respective total mTOR levels. Columns represent mean values of three independent experiments per group ± SD. **P < 0.01, ***P < 0.001, indicating a significant difference vs the untreated control.
