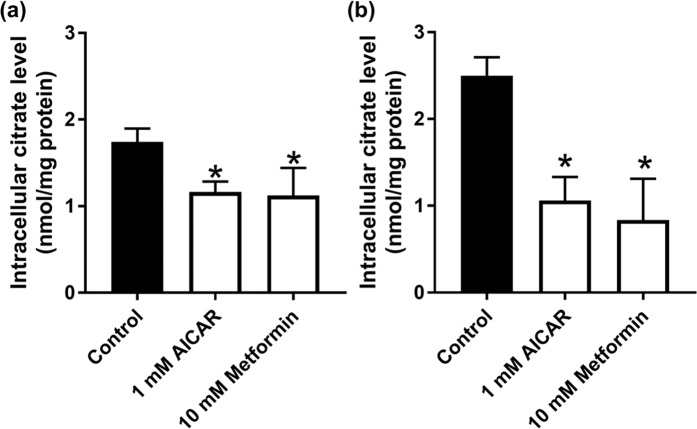
Figure 8.
Intracellular levels of citrate in control and metformin- and AICAR-treated HepG2 cells. Cells were cultured either in 20-mM glucose medium (a) or 5-mM glucose medium (b) and treated with or without 1 mM AICAR or 10 mM metformin for 24 h. Following this treatment, cells were exposed to 200 µM citrate for 30 min in a NaCl-containing uptake buffer. Cells were then collected and used for measurement of citrate. Data represent mean ± S.D. (n = 6). *P < 0.05 indicates a significant difference vs the corresponding control.

