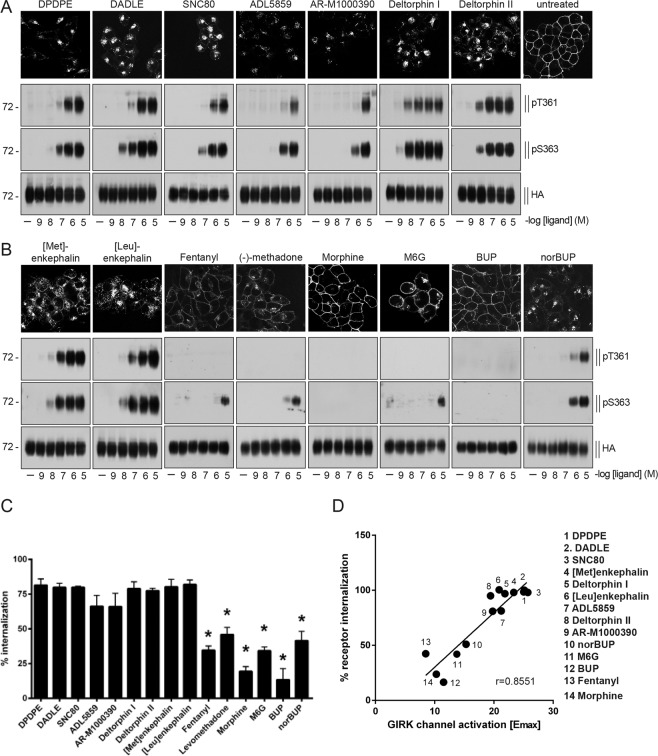
Figure 4.
Agonist-induced DOP receptor phosphorylation and internalization. (A,B top) Stably HA-tagged hDOP receptor-expressing HEK293 cells were preincubated with anti-HA antibody, followed by stimulation with 10 µM DPDPE, DADLE, SNC80, ADL5859, AR-M1000390, deltorphin I, deltorphin II, [Met]-enkephalin, [Leu]-enkephalin, fentanyl, (−)-methadone, morphine, morphine-6-glucuronide (M6G), buprenorphine (BUP), norbuprenorphine (norBUP) or vehicle for 30 min at 37 °C. Cells were fixed, permeabilized, immunofluorescently stained, and subsequently examined using confocal microscopy. Images are representative, n = 3. Scale bar, 20 µm. (A,B bottom) HEK293 cells stably expressing HA-hDOP receptor were stimulated with the compounds listed in (A) or vehicle at concentrations ranging from 10-9 to 10-5 M for 10 min at 37 °C. Lysates were immunoblotted with antibodies to pT361 or pS363. Blots were stripped and reprobed with the anti-HA antibody. Blots are representative, n = 3-5. (C) Cells described in (A) were preincubated with anti-HA antibody and stimulated with vehicle or 10 µM of compounds listed in (A) for 30 min at 37 °C. Cells were fixed and labeled with a peroxidase-conjugated secondary antibody. Receptor internalization was measured by ELISA and quantified as the percentage of internalized receptors in agonist-treated cells compared to untreated cells. Data are means ± SEM of five independent experiments performed in quadruplicate. Results were analyzed by one-way ANOVA followed by Bonferroni’s post-hoc test (*p < 0.05). (D) Correlation between G protein-mediated (GIRK channel activation, Emax) and arrestin-mediated (internalization, % of untreated control cells) agonist effects in HA-hDOP receptor-transfected HEK293 cells (internalization) or AtT-20 cells (GIRK channel activation). Solid line, linear regression analysis revealed a correlation coefficient r = 0.8551.

