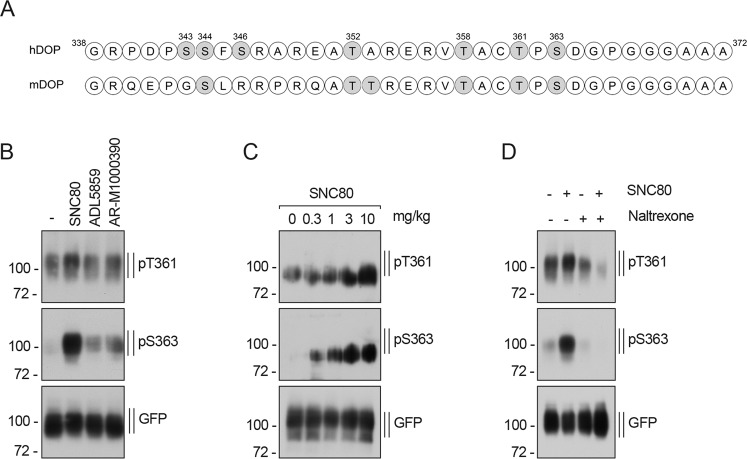
Figure 7.
Agonist-induced DOP receptor phosphorylation in mouse brain. (A) Schematic representation of the human (h) and mouse (m) DOP receptor C-terminal tail. All potential phosphate acceptor sites are depicted in gray. (B) After injection of 0.9% NaCl (i.p.), 10 mg/kg SNC80 (i.p.), 100 mg/kg ADL5859 (p.o.) or 60 mg/kg AR-M1000390 (p.o.) for 15 min, DOP-eGFP knock-in mice. were euthanized and brains were removed. DOP receptor was immunoprecipitated with anti-GFP protein agarose beads and immunoblotted with antibodies to pT361 or pS363. Blots were stripped and reprobed for GFP. Blots are representative, n = 3. (C) As in (B), but mice were treated with SNC80 (i.p.) at the indicated doses for 15 min. Blots are representative, n = 3. (D) As in (B), but mice were treated with 10 mg/kg naltrexone or SNC80 alone or pretreated with naltrexone for 15 min followed by SNC80 (10 mg/kg, i.p.). Blots are representative, n = 3. Positions of molecular mass markers are indicated on the left (in kDa).

