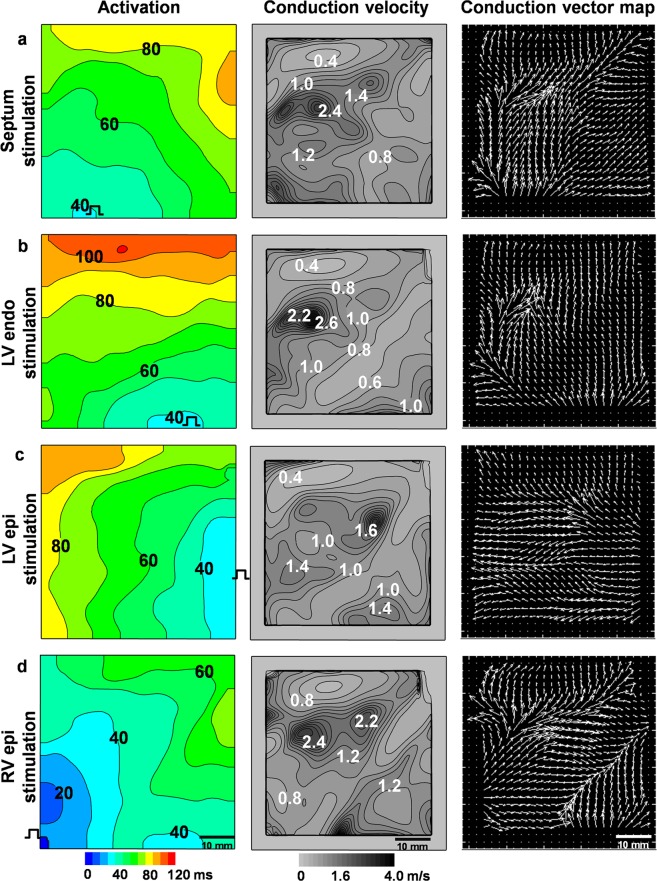
Figure 3.
Electrical activity in the pig heart recorded by optical mapping in situ using the fluorescent dye di-4-ANBDQBS under artificial blood circulation. Activation time, conduction velocity and vector maps were obtained during pacing at four different locations, i.e., the septum (a), left ventricular endocardium (LV endo) (b), left ventricular epicardium (LV epi) (c), and right ventricular epicardium (RV epi) (d), with a 500-ms period. The numbers near the isochrones show the activation time in ms in the activation maps and the conduction velocity in m/s in the conduction velocity maps. The interval between isochrones is 10 ms for the activation time and 0.2 m/s for the conduction velocity.

