Figure 4.
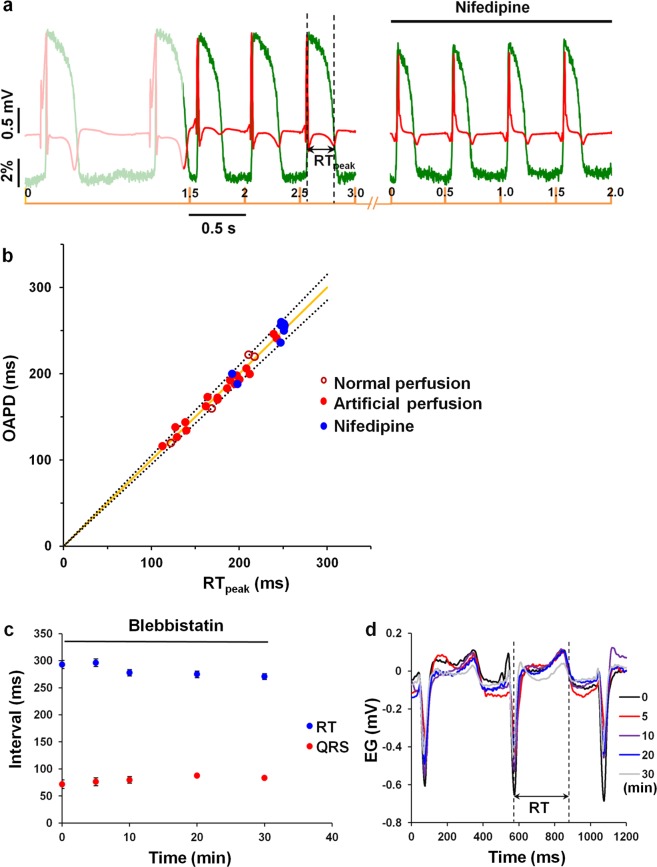
Correlation between the optical and electrical signals of the pig heart. Optical signals were recorded by optical mapping in situ using di-4-ANBDQBS and electrical signals via electrography under artificial blood circulation. (a) Experimental recordings of optical action potentials obtained using di-4-ANBDQBS and electrograms during spontaneous rhythm and under applied stimulation with a period of 500 ms under the control condition and after the injection of a 50-mL bolus containing nifedipine (100 µmol/L). (b) The correlation between the duration of the optical signal at 60% repolarization (OAPD) and electrical signal (RTpeak) obtained under normal-physiological (n = 4, open red dots) or artificial blood perfusion, including with nifedipine (n = 4, closed red and blue dots, respectively). The presented data were obtained during spontaneous activity and a pacing period of 200–500 ms. The solid line indicates the theoretical linear dependence of OAPD and RTpeak, and the dashed lines indicate the boundaries of 5% deviation from the absolute values of the line points. (c) Effect of blebbistatin (bolus concentration 600 µmol/L) on the RT (blue points) and QRS (red points) intervals (n = 4). The pacing period was 500 ms. (d) Overlapped electrogram fragments recorded at different times after exposure to blebbistatin. The dashed lines mark the boundaries of the RT interval. EG, electrogram.

