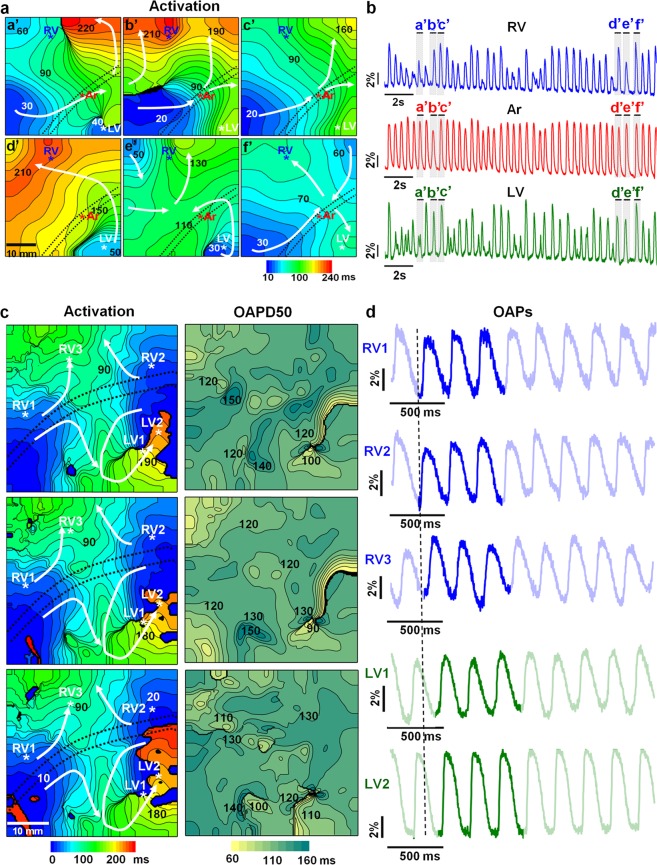
Figure 6.
Ventricular reentrant arrhythmias with possible functional obstacles (a,b) and with possible stable anatomical obstacles (c,d) recorded by optical mapping of the pig heart in situ using di-4-ANBDQBS under physiological (a,b) or artificial blood circulation(c,d). (a) Activation time maps. The numbers near the isochrones show the activation time in ms. The interval between isochrones is 10 ms. The mapping area was 40 × 40 mm. The excitation period was approximately 500 ms (42 excitations per 20 s). The dominant frequency in the right ventricle (RV) was 9.3 Hz. (b) Recordings of raw optical traces from the regions of the RV, coronary artery (Ar), and left ventricle (LV), indicated by asterisks in the activation maps. The OAPs are labelled with letters (a’-f’) corresponding to the labelling of the activation time maps. (c) Activation time and OAPD50 maps (left and right columns, respectively). The numbers near the isochrones show the activation time and OAPD50 in ms. The interval between isochrones is 10 ms. The mapping area was 55 × 55 mm. The dominant frequency in the LV was 15.6 Hz. (d) Recordings of raw optical traces from the sites indicated by asterisks in the activation maps (c, left column) from several regions of the RV and LV, starting from the vertical dashed line. The three bright OAPs (d) corresponding to the three OAPD50 maps. The white arrows indicate the direction of wave propagation. The black dotted lines on the maps indicate the central part of the anterior interventricular sulcus, where the coronary vessels are located. The amplitudes of the OAPs are given as percentages with respect to the background (ΔF/F).

