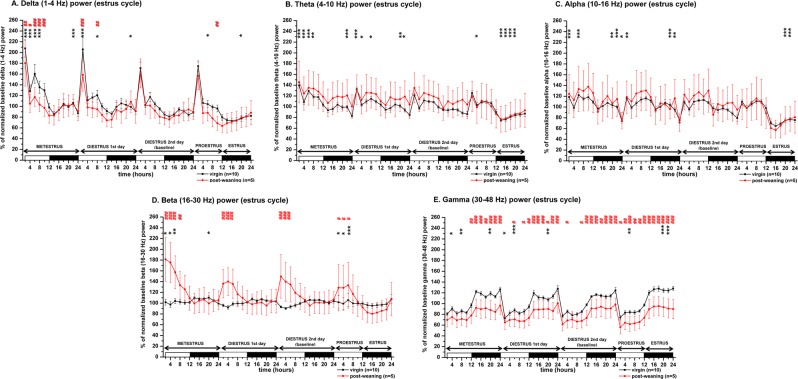
Figure 3.
LFP power changes during the virgin EST cycle (n = 10, thick black line) and the PW EST cycle (n = 5, thin red line). Panel A: delta power (1–4 Hz); panel B: theta power (4–10 Hz); panel C: alpha/sigma power (10–16 Hz); panel D: beta power (16–30 Hz); panel E: gamma power (30–48 Hz). Power values are expressed as percentage of normalized baseline (DIE2 day of the virgin EST cycle) values and summarized in 2-h long blocks. MET duration was taken to be 24 hours, DIE 48 hours (DIE 1st day and DIE 2nd day) while PRO and EST 12–12 hours, respectively. White and black bars at the X axis represent light- and DPs, respectively. Black asterisks (*) indicate significant deviation from the corresponding baseline value in case of the virgin EST cycle data. DIE2 day values were defined as baseline. Red hashes (#) indicate significant deviation in a point-to-point comparison from the corresponding reference value in case of the PW EST cycle data. The corresponding virgin EST cycle data were defined here as reference. Significance was tested with two-way ANOVA with time and treatment as factors, followed by Sidak’s multiple comparisons test. Significance levels: *,# - p < 0.05; **,## - p < 0.01; ***,### - p < 0.001. Data are expressed as mean ± S.E.M.

