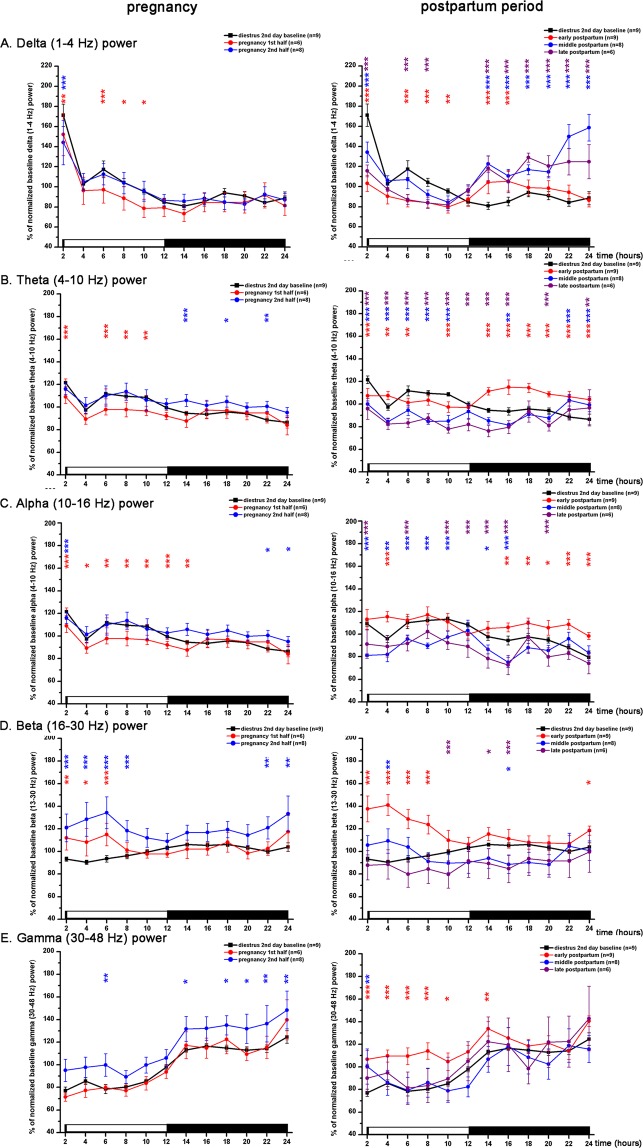
Figure 5.
LFP power changes during the PREG and postpartum periods. LFP is shown for DIE2 day of the virgin EST cycle (n = 10), the first half of the PREG (PREG10 day, n = 6), the second half of the PREG (PREG20 day, n = 8), early PP (PP2 day, n = 9), middle PP (PP9 day) and late PP (PP16 day, n = 6). Panel A: delta power (1–4 Hz); panel B: theta power (4–10 Hz); panel C: alpha/sigma power (10–16 Hz); panel D: beta power (16–30 Hz); panel E: gamma power (30–48 Hz). Power values are expressed as percentage of normalized baseline (DIE2 day of the virgin EST cycle) values and summarized in 2-h long blocks. Red asterisks (*) indicate significant deviation during PREG10 day (left column) or PP2 day (right column), respectively, compared to DIE2 baseline. Blue asterisks (*) indicate significant deviation during PREG20 day (left column) or PP9 day (right column), respectively, compared to DIE2 baseline. Purple asterisks (*) indicate significant deviation during PP16 day (right column), respectively, compared to DIE2 baseline. Significance was tested with two-way ANOVA with time and treatment as factors, followed by Sidak’s multiple comparisons test. Significance levels: *,*,* - p < 0.05; **,**,** - p < 0.01; ***,***,*** - p < 0.001. Data are expressed as mean ± S.E.M.

