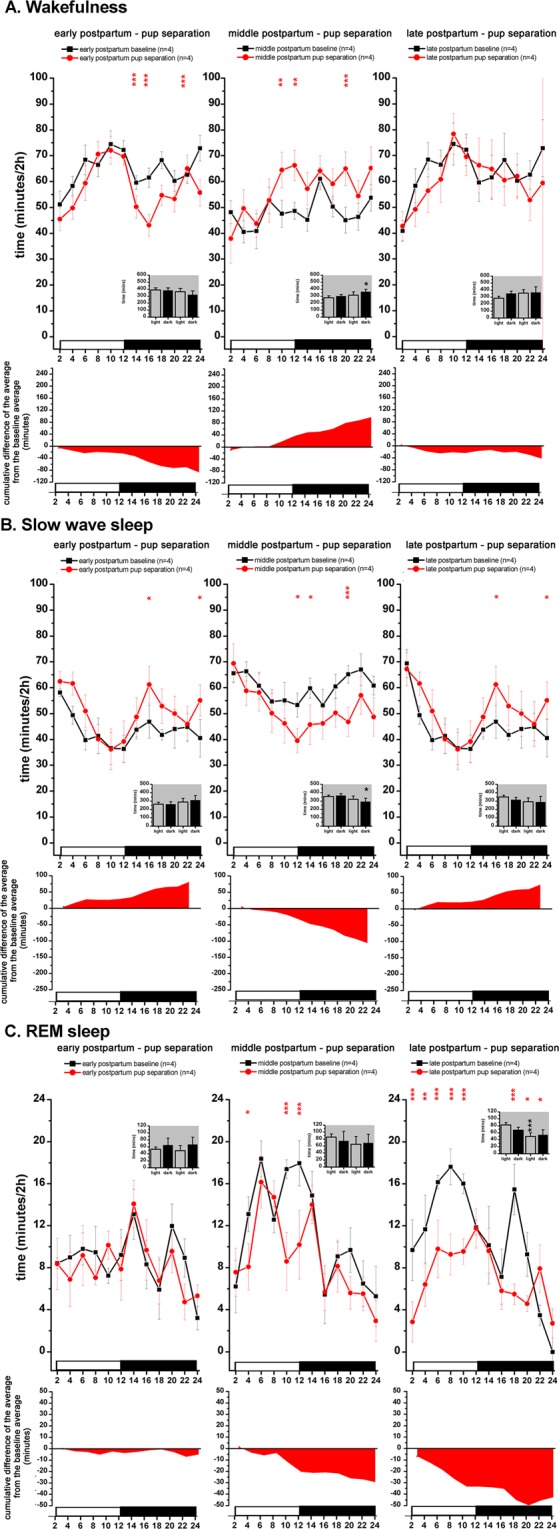
Figure 6.

S-W changes during the mother-pup separation sessions. From left to right: separation sessions performed during early PP (n = 4, PP3 day), middle PP (n = 4, PP10 day) and late PP (n = 4, PP17 day). Corresponding PP baseline recordings served as baseline (n = 4, PP2 for PP3 separation; n = 4, PP9 for PP10 separation; n = 4, PP16 for PP17 separation; n = 5). Averaged baseline values were calculated from the identical rats subjected to the actual treatment in each case. Panel A: W; panel B: SWS; panel c: REM sleep. Black lines indicate baseline values, red lines show pup separation values. On each panel, cumulative difference of the averages from the corresponding baseline average is depicted helping to assess the direction of the changes as well as the accumulating S-W deficit or excess regarding homeostatic sleep regulation. Data were analyzed in 2-h long bins and expressed as minutes/2-h. Small insets show summarized W (panel A), SWS (panel B) and REM sleep (panel C) amounts for the 12:12 hours light-DPs, respectively (Panel A-C). White and black bars at the X axis represent light- and DPs, respectively. Red asterisks (*) indicate significant deviation from the corresponding baseline value. In the insets, black asterisks (*) indicate significant difference of the LP and DP values, respectively, compared to the corresponding baseline. Significance was tested with two-way ANOVA with time and treatment as factors, followed by Sidak’s multiple comparisons test. Significance levels: *,* - p < 0.05; **,** - p < 0.01; ***,*** - p < 0.001. Data are expressed as mean ± S.E.M.
