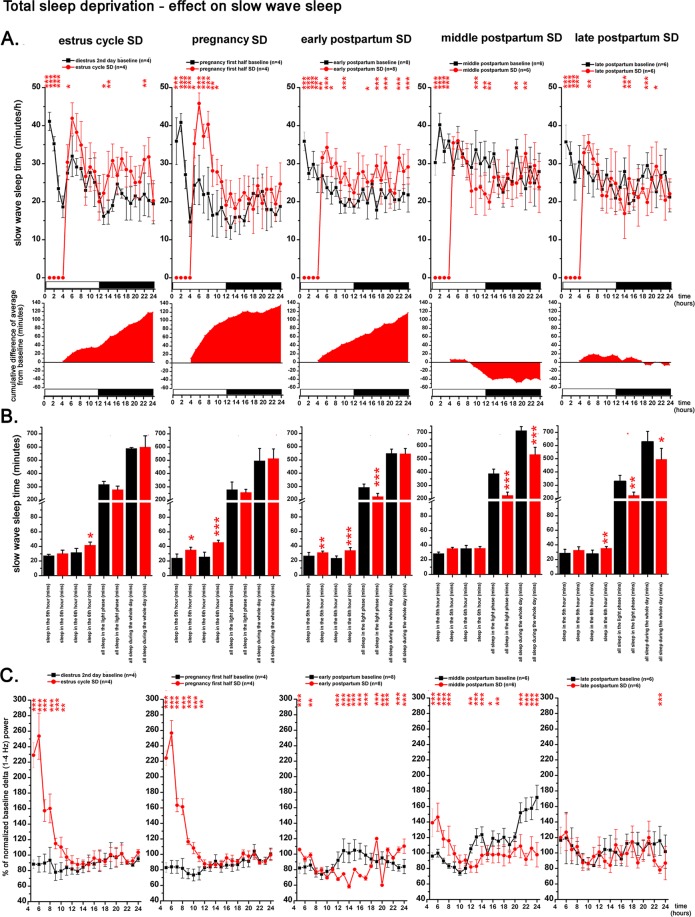
Figure 8.
Effect of 4-h gentle handling total sleep deprivation on SWS and delta power during the virgin EST cycle (n = 4), PREG (n = 4, PREG12 day), early PP period (n = 8, PP4 day), middle PP period (n = 6, PP11 day), and late PP period (n = 6, PP17 day). Corresponding baselines in the same order: DIE2 day of the virgin EST cycle (n = 4), PREG10 day (n = 4), PP2 (n = 8), PP9 (n = 6) and PP16 (n = 6) days. Panel A: SWS times in minutes/h. Black lines indicate baseline values, red lines show values after SDep. Cumulative difference of the averages from the corresponding baseline shows the dynamics of SWS compensation in time after SDep. Panel B: SWS times in minutes summarized in 4 different periods (5th hour; 6th hour; whole LP; whole day) after the 4-h SDep session. Black columns: baseline values, red columns: values after SDep. Panel C: changes of normalized delta (1–4 Hz) power expressed as percentage of corresponding baseline. Black lines: baseline; red lines: after SDep. Note that SDep caused complete SWS suppression in the deprivation period (panel A). Also note that delta power values belonging to the deprivation period as well as to the corresponding baseline period are not plotted on panel C. Averaged baseline values were calculated from the identical rats subjected to the actual SDep session in each cases. White and black bars at the X axis represent light- and DPs, respectively. On panel A and C, red asterisks (*) indicate significant deviation from the corresponding baseline value. Significance was tested by two-way ANOVA with time and treatment as factors, followed by Sidak’s multiple comparisons test. On panel B, SWS times in the 5th and 6th hours after SDep, respectively, were compared to corresponding baseline values as parts of time series using two-way ANOVA. SWS times during the whole LP and during the whole day in case of SDep were compared with the corresponding baseline values using Welch’s t-test. Significance levels: * - p < 0.05; ** - p < 0.01; *** - p < 0.001. Data are expressed as mean ± S.E.M.

