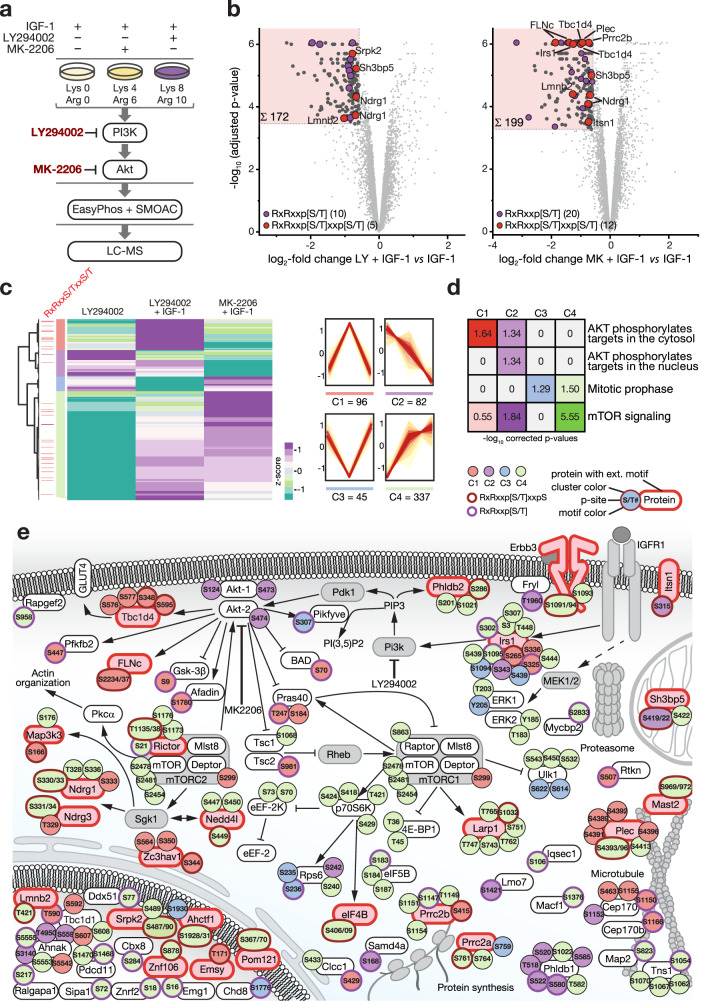
Fig. 3. FLNc is a component of the PI3K/Akt/mTOR signaling network and differentially phosphorylated within the extended motif RxRxxpSxxpS.
a Contracting C2 myotubes differentially labeled using SILAC amino acids were treated for 30 min with IGF-1 or IGF-1 together with MK-2206 (MK) or LY294002 (LY) to stimulate or inhibit PI3K/Akt signaling as indicated. Cell lysates were mixed in equal amount for phosphopeptide enrichment employing the EasyPhos method in combination with sequential enrichment using metal oxide affinity chromatography (SMOAC) and LC-MS analysis. b Volcano plots of phosphopeptides with localized phosphosites quantified in skeletal myotubes treated with IGF-1 + LY (left) or IGF-1 + MK (right) in comparison to IGF-1. Log2-transformed mean SILAC ratios were plotted against -log10 adjusted p values. Phosphopeptides with a minimum fold change of 1.5 and a FDR lower than 0.01 (n = 6 independent experiments; two-tailed moderated student’s t-test) are shown as dark gray circles or color-coded according to their phosphorylation sequence motif as indicated. Regions of interest are highlighted in each plot. c. Hierarchical cluster analysis of cluster 2 shown in Supplementary Fig. 4f and the respective phosphopeptide profiles in each subcluster. Phosphopeptides with dual-site phosphorylation in the extended basophilic motif are indicated (light red lines, left side). d Reactome29 analysis of phosphopeptides of the cluster 1–4 depicted in (c). Shown are overrepresented pathways with a corrected p value ≤ 0.05. e Excerpt from the canonical IGF-1 activated signaling pathway, comprising the downstream signaling branch of the PI3K/Akt signaling cascade. Interactions were curated from the literature and the KEGG database. Phosphorylation sites are color-coded according to their cluster affiliation shown in (c) and the presence of the short or extended basophilic motif. Proteins comprising the extended basophilic motif are further highlighted in red; proteins not identified are shown in light gray. Proteins are represented by their gene name or UniProt shortname.

